| __timestamp | Hubbell Incorporated | Ryanair Holdings plc |
|---|---|---|
| Wednesday, January 1, 2014 | 591600000 | 192800000 |
| Thursday, January 1, 2015 | 617200000 | 233900000 |
| Friday, January 1, 2016 | 622900000 | 292700000 |
| Sunday, January 1, 2017 | 648200000 | 322300000 |
| Monday, January 1, 2018 | 743500000 | 410400000 |
| Tuesday, January 1, 2019 | 756100000 | 547300000 |
| Wednesday, January 1, 2020 | 676300000 | 578800000 |
| Friday, January 1, 2021 | 619200000 | 201500000 |
| Saturday, January 1, 2022 | 762500000 | 411300000 |
| Sunday, January 1, 2023 | 848600000 | 674400000 |
| Monday, January 1, 2024 | 812500000 | 757200000 |
Unleashing the power of data
In the world of corporate finance, understanding operational costs is crucial. This analysis delves into the Selling, General, and Administrative (SG&A) expenses of two industry titans: Ryanair Holdings plc and Hubbell Incorporated, from 2014 to 2023.
Ryanair, a leader in low-cost aviation, saw its SG&A expenses soar by approximately 250% over the decade. Notably, 2023 marked a peak with expenses reaching 675 million, reflecting a strategic expansion and increased operational complexity.
Hubbell, a stalwart in electrical products, exhibited a more stable trajectory. Its SG&A expenses grew by about 43%, peaking in 2023 at 849 million. This steady rise underscores Hubbell's consistent market presence and operational efficiency.
While Ryanair's expenses reflect dynamic growth, Hubbell's stability highlights its enduring market strategy. Missing data for Hubbell in 2024 suggests a need for further analysis.
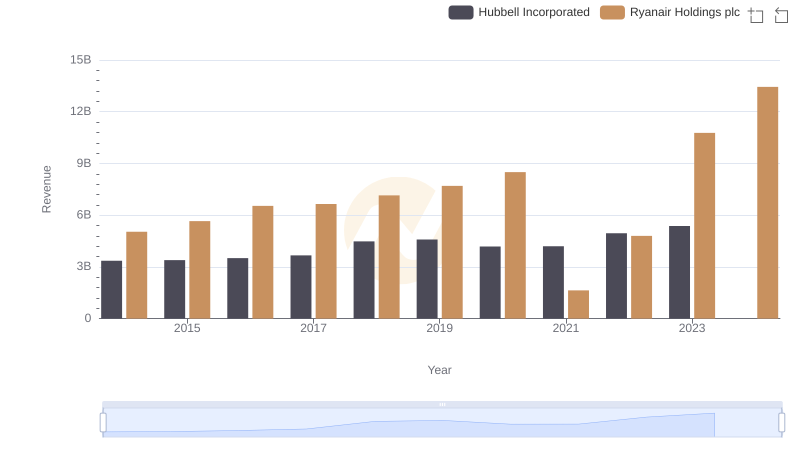
Ryanair Holdings plc vs Hubbell Incorporated: Annual Revenue Growth Compared

Cost of Revenue Trends: Ryanair Holdings plc vs Hubbell Incorporated
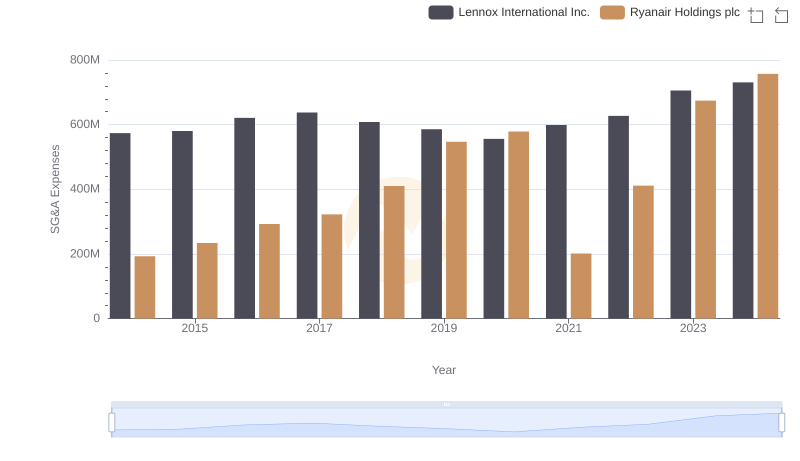
Breaking Down SG&A Expenses: Ryanair Holdings plc vs Lennox International Inc.
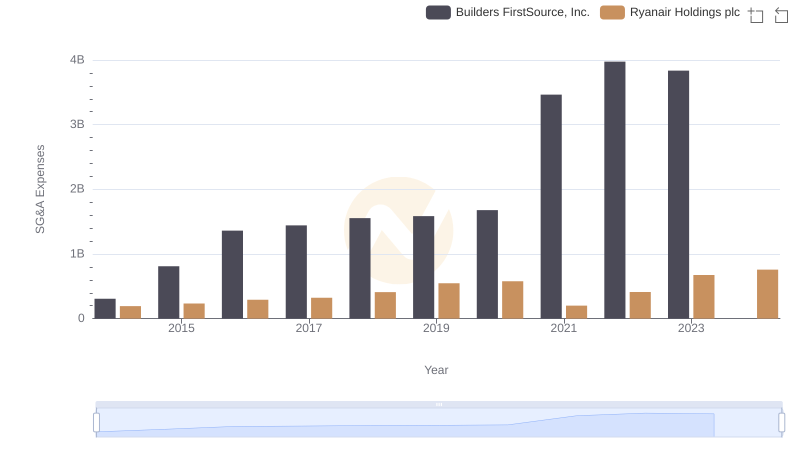
Cost Management Insights: SG&A Expenses for Ryanair Holdings plc and Builders FirstSource, Inc.

Breaking Down SG&A Expenses: Ryanair Holdings plc vs Southwest Airlines Co.
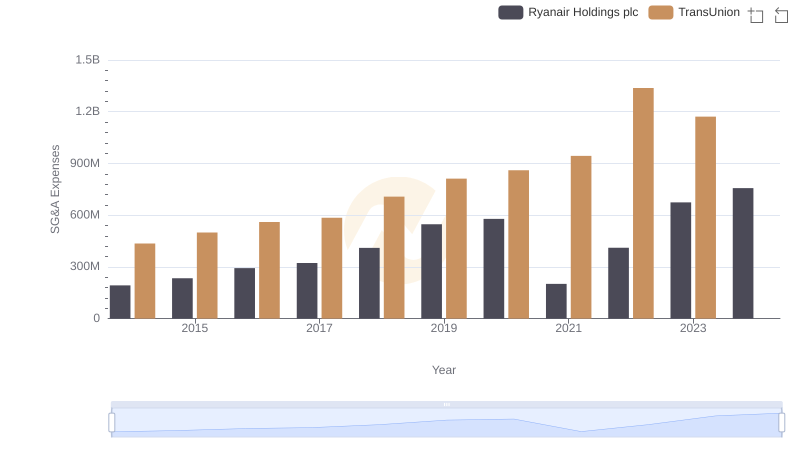
Comparing SG&A Expenses: Ryanair Holdings plc vs TransUnion Trends and Insights
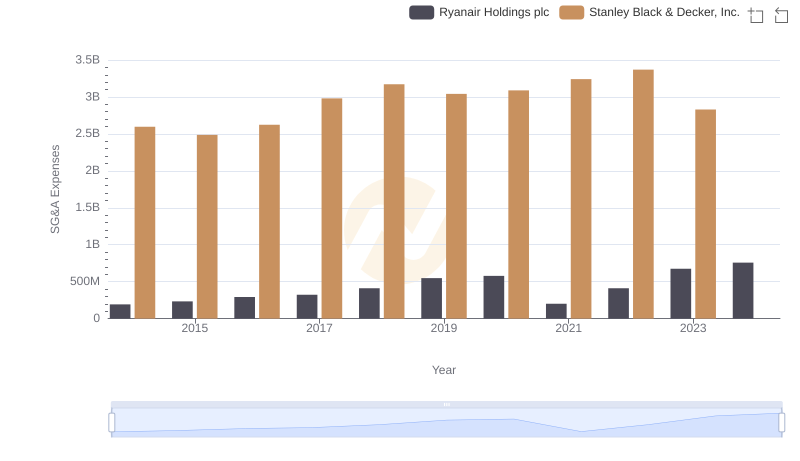
Operational Costs Compared: SG&A Analysis of Ryanair Holdings plc and Stanley Black & Decker, Inc.
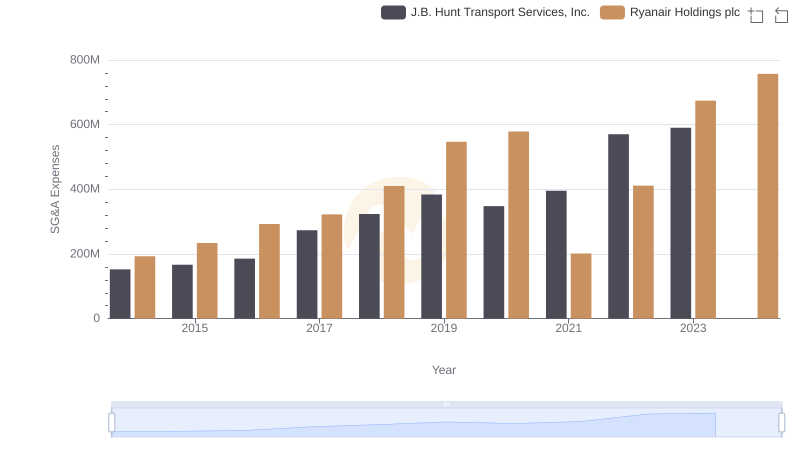
Selling, General, and Administrative Costs: Ryanair Holdings plc vs J.B. Hunt Transport Services, Inc.
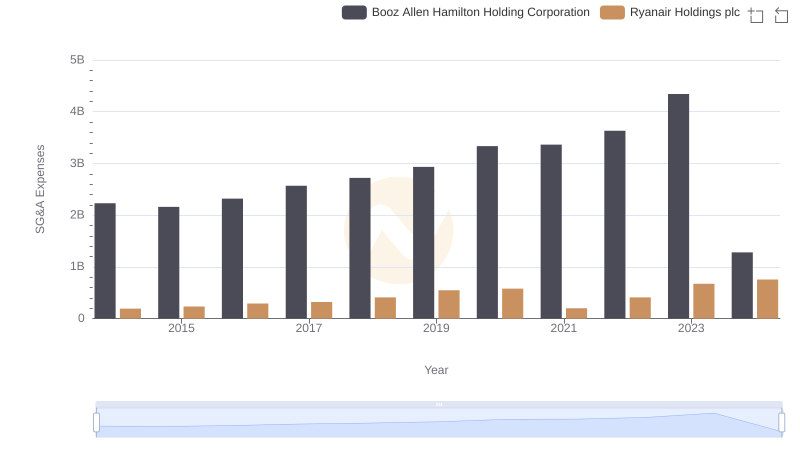
Cost Management Insights: SG&A Expenses for Ryanair Holdings plc and Booz Allen Hamilton Holding Corporation
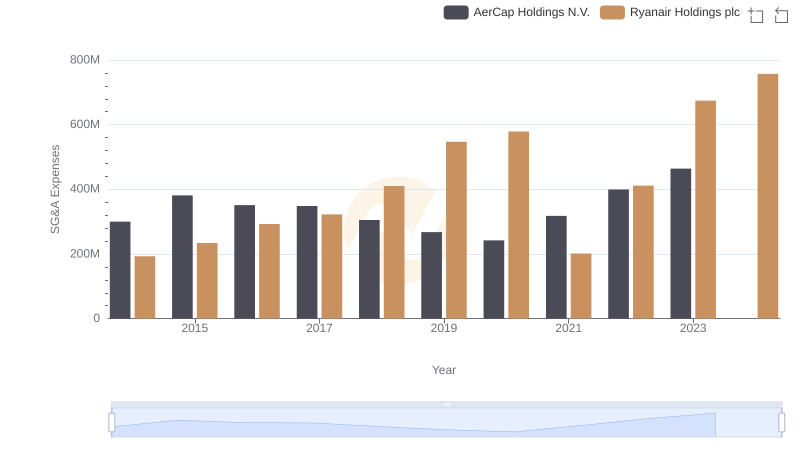
Ryanair Holdings plc and AerCap Holdings N.V.: SG&A Spending Patterns Compared