| __timestamp | Ryanair Holdings plc | Stanley Black & Decker, Inc. |
|---|---|---|
| Wednesday, January 1, 2014 | 3838100000 | 7235900000 |
| Thursday, January 1, 2015 | 3999600000 | 7099800000 |
| Friday, January 1, 2016 | 4355900000 | 7139700000 |
| Sunday, January 1, 2017 | 4294000000 | 7969200000 |
| Monday, January 1, 2018 | 4512300000 | 9080500000 |
| Tuesday, January 1, 2019 | 5492800000 | 9636700000 |
| Wednesday, January 1, 2020 | 6039900000 | 9566700000 |
| Friday, January 1, 2021 | 1702700000 | 10423000000 |
| Saturday, January 1, 2022 | 4009800000 | 12663300000 |
| Sunday, January 1, 2023 | 7735000000 | 11683100000 |
| Monday, January 1, 2024 | 9566400000 | 10851300000 |
Data in motion
In the ever-evolving landscape of global business, understanding cost dynamics is crucial. Ryanair Holdings plc and Stanley Black & Decker, Inc. offer a fascinating study in contrasts. From 2014 to 2023, Ryanair's cost of revenue surged by approximately 150%, reflecting its aggressive expansion and operational strategies. Notably, 2021 marked a significant dip, likely due to pandemic-related disruptions, but the airline rebounded strongly by 2023.
Meanwhile, Stanley Black & Decker's cost of revenue exhibited a steady upward trajectory, peaking in 2022 with a 75% increase from 2014. This growth underscores the company's resilience and adaptability in the face of global supply chain challenges. However, data for 2024 remains elusive, leaving room for speculation.
These trends highlight the diverse strategies and challenges faced by companies in different sectors, offering valuable insights for investors and industry analysts alike.
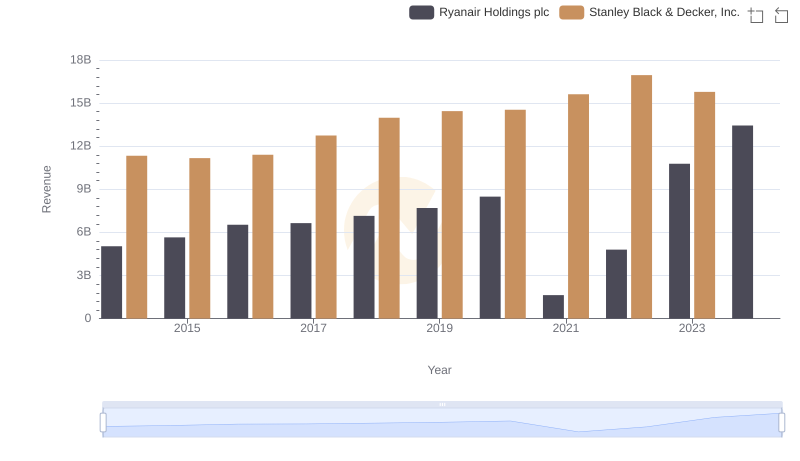
Annual Revenue Comparison: Ryanair Holdings plc vs Stanley Black & Decker, Inc.
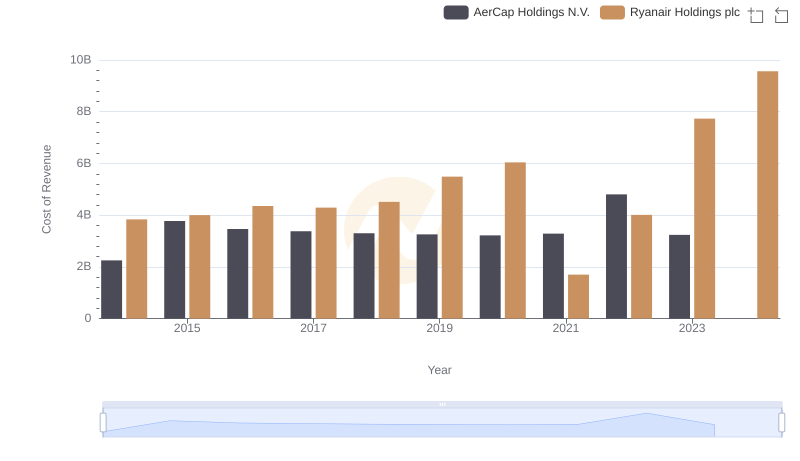
Cost of Revenue: Key Insights for Ryanair Holdings plc and AerCap Holdings N.V.
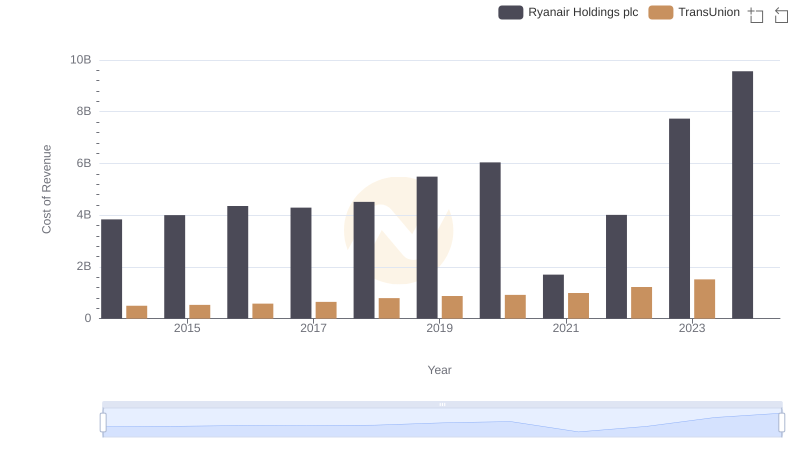
Ryanair Holdings plc vs TransUnion: Efficiency in Cost of Revenue Explored
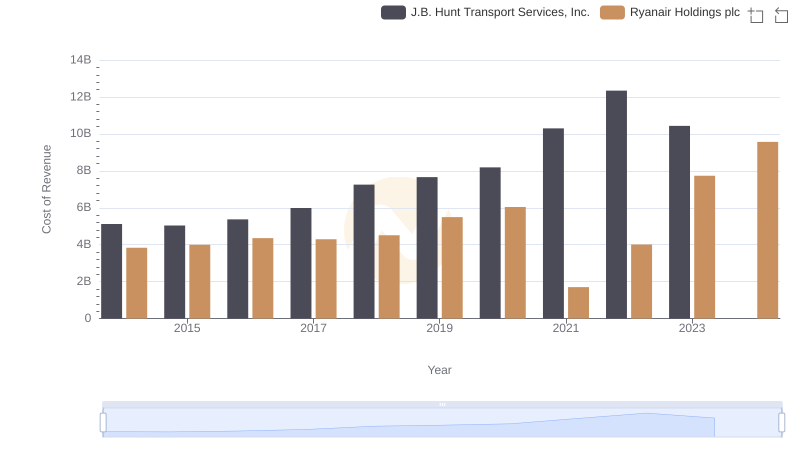
Ryanair Holdings plc vs J.B. Hunt Transport Services, Inc.: Efficiency in Cost of Revenue Explored
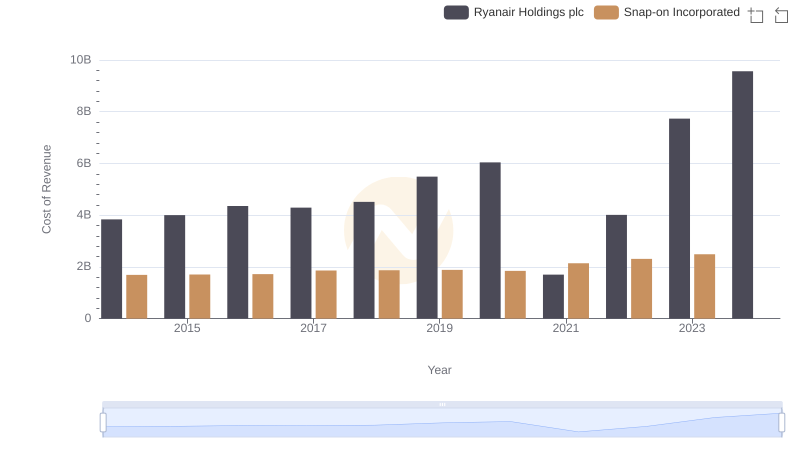
Comparing Cost of Revenue Efficiency: Ryanair Holdings plc vs Snap-on Incorporated
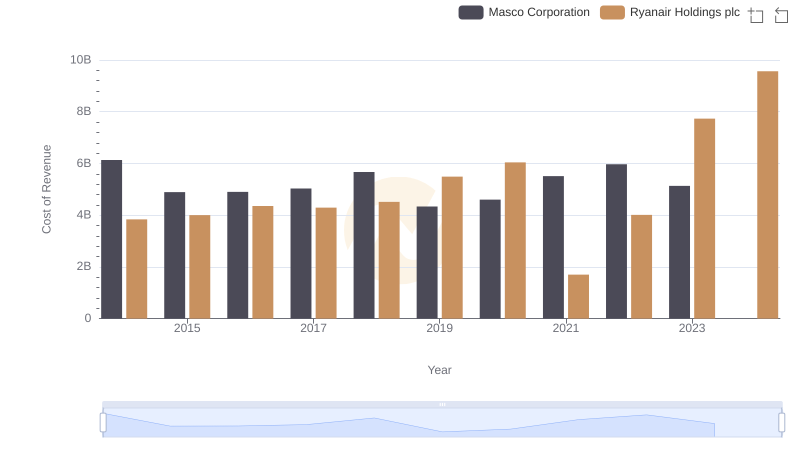
Cost of Revenue Trends: Ryanair Holdings plc vs Masco Corporation
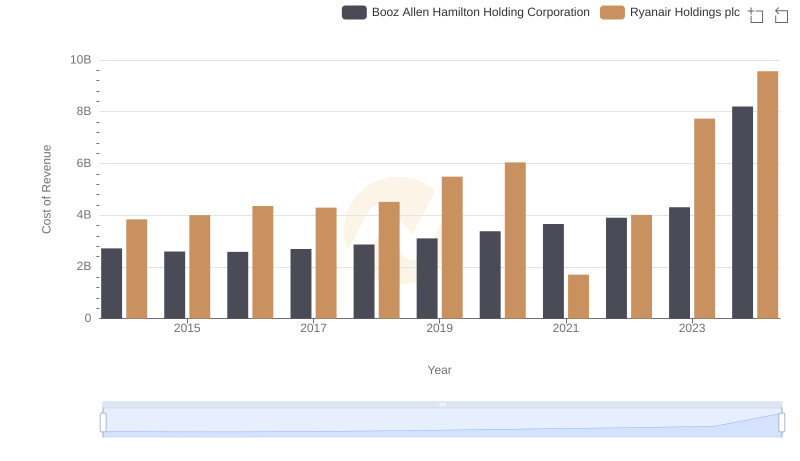
Comparing Cost of Revenue Efficiency: Ryanair Holdings plc vs Booz Allen Hamilton Holding Corporation
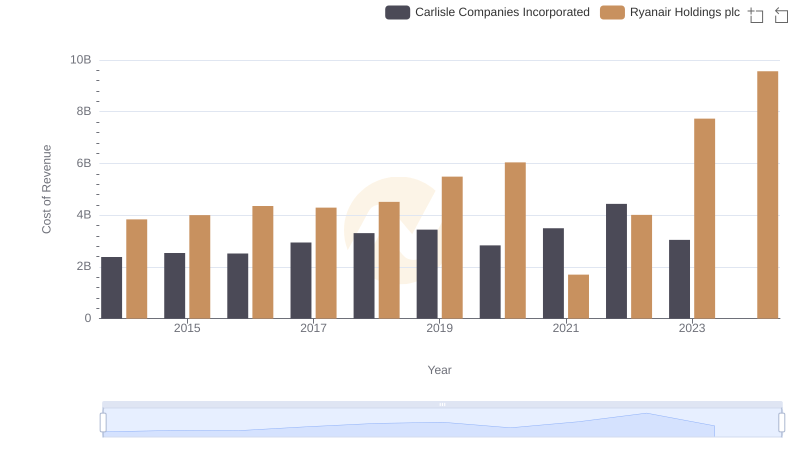
Cost of Revenue Comparison: Ryanair Holdings plc vs Carlisle Companies Incorporated

Operational Costs Compared: SG&A Analysis of Ryanair Holdings plc and Stanley Black & Decker, Inc.

Ryanair Holdings plc or Stanley Black & Decker, Inc.: Who Leads in Yearly Revenue?
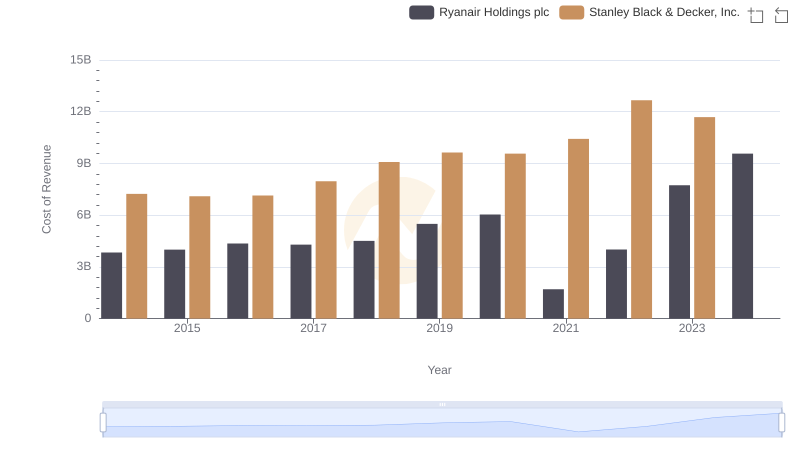
Cost of Revenue Comparison: Ryanair Holdings plc vs Stanley Black & Decker, Inc.
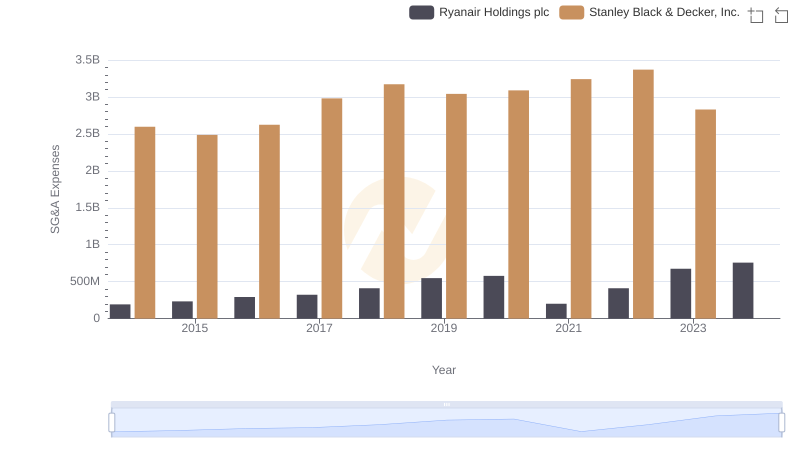
SG&A Efficiency Analysis: Comparing Ryanair Holdings plc and Stanley Black & Decker, Inc.