| __timestamp | J.B. Hunt Transport Services, Inc. | Ryanair Holdings plc |
|---|---|---|
| Wednesday, January 1, 2014 | 5124095000 | 3838100000 |
| Thursday, January 1, 2015 | 5041472000 | 3999600000 |
| Friday, January 1, 2016 | 5369826000 | 4355900000 |
| Sunday, January 1, 2017 | 5990275000 | 4294000000 |
| Monday, January 1, 2018 | 7255657000 | 4512300000 |
| Tuesday, January 1, 2019 | 7659003000 | 5492800000 |
| Wednesday, January 1, 2020 | 8186697000 | 6039900000 |
| Friday, January 1, 2021 | 10298483000 | 1702700000 |
| Saturday, January 1, 2022 | 12341472000 | 4009800000 |
| Sunday, January 1, 2023 | 10433277000 | 7735000000 |
| Monday, January 1, 2024 | 9566400000 |
Data in motion
In the competitive landscape of transportation, cost efficiency is paramount. This analysis delves into the cost of revenue trends for Ryanair Holdings plc and J.B. Hunt Transport Services, Inc. from 2014 to 2023. Over this period, J.B. Hunt consistently demonstrated a higher cost of revenue, peaking in 2022 with a 140% increase from 2014. In contrast, Ryanair's cost of revenue fluctuated, notably dropping to its lowest in 2021, before surging by 354% in 2023.
The data reveals that while J.B. Hunt's costs steadily rose, Ryanair experienced more volatility, reflecting its dynamic operational adjustments. This comparison highlights the strategic differences in managing operational costs between a leading airline and a top logistics company. Missing data for J.B. Hunt in 2024 suggests a need for further analysis to understand future trends. Such insights are crucial for investors and industry analysts aiming to gauge financial health and operational efficiency.

Comparing Cost of Revenue Efficiency: Ryanair Holdings plc vs Southwest Airlines Co.
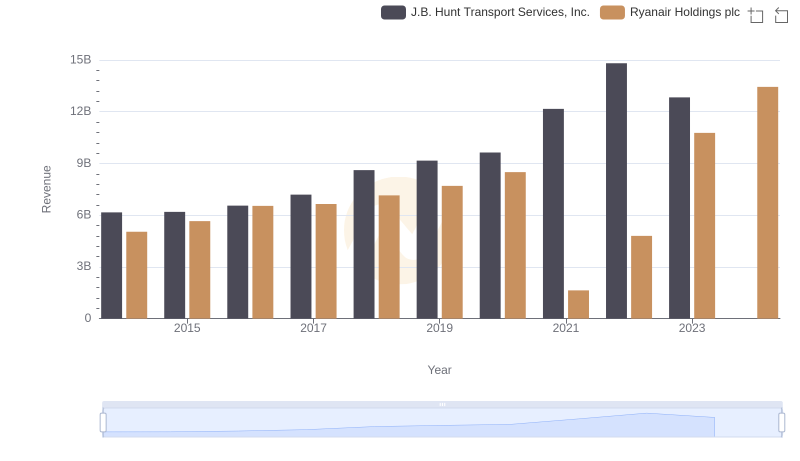
Ryanair Holdings plc vs J.B. Hunt Transport Services, Inc.: Annual Revenue Growth Compared
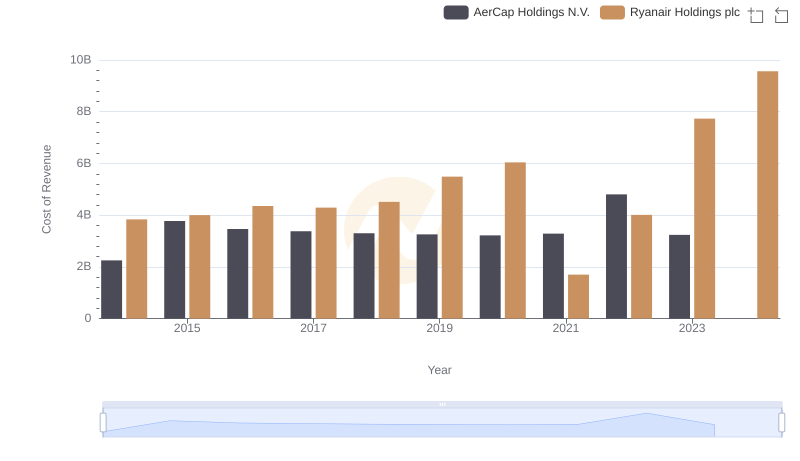
Cost of Revenue: Key Insights for Ryanair Holdings plc and AerCap Holdings N.V.
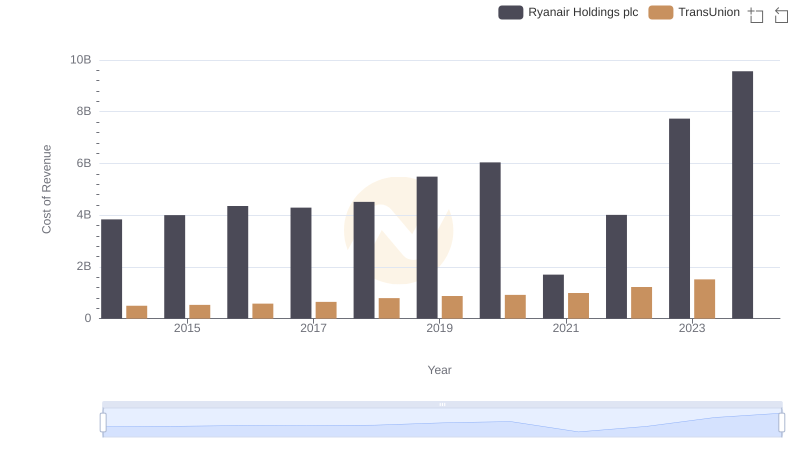
Ryanair Holdings plc vs TransUnion: Efficiency in Cost of Revenue Explored
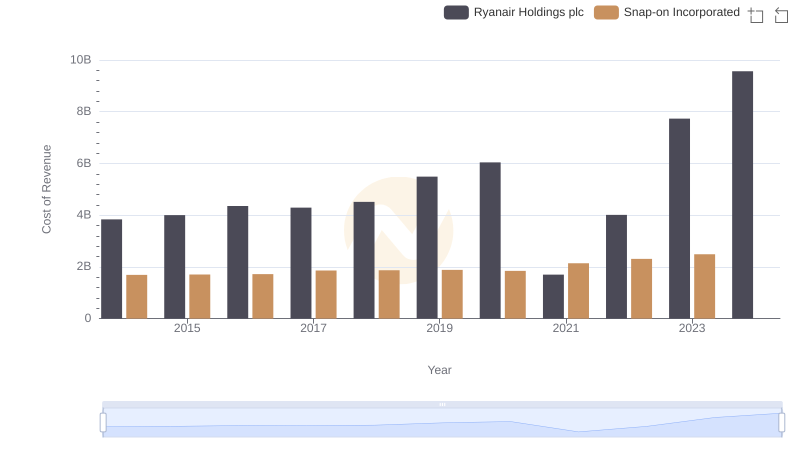
Comparing Cost of Revenue Efficiency: Ryanair Holdings plc vs Snap-on Incorporated
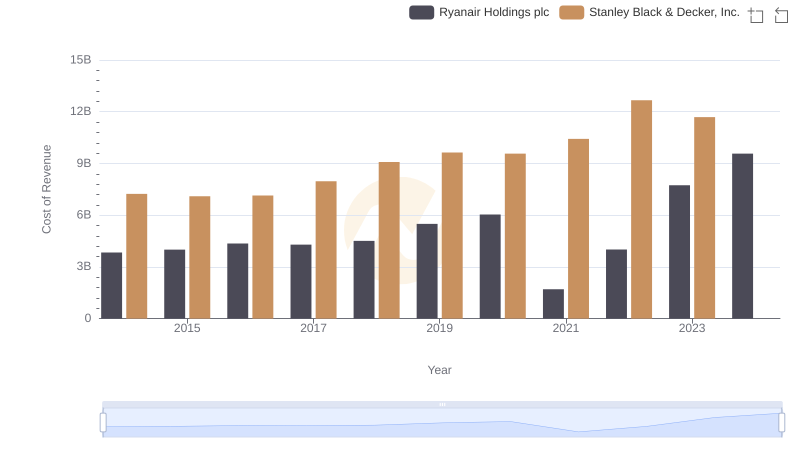
Cost of Revenue Trends: Ryanair Holdings plc vs Stanley Black & Decker, Inc.
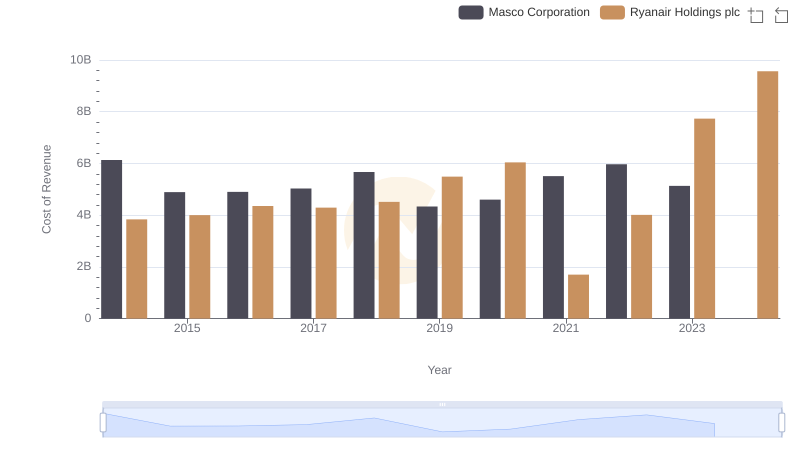
Cost of Revenue Trends: Ryanair Holdings plc vs Masco Corporation
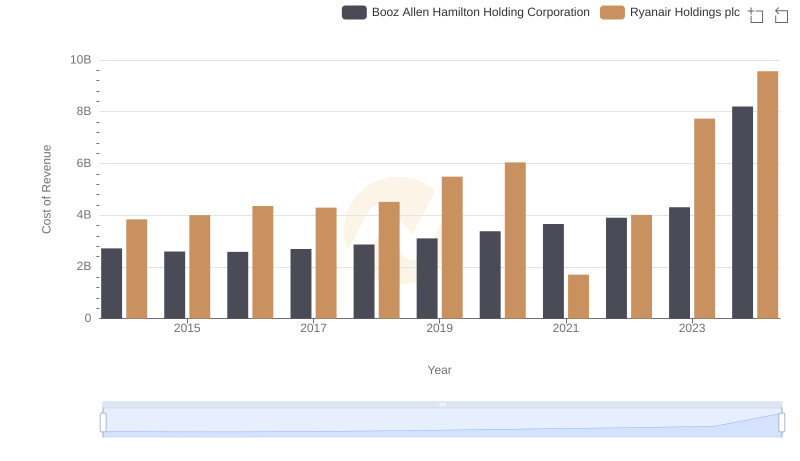
Comparing Cost of Revenue Efficiency: Ryanair Holdings plc vs Booz Allen Hamilton Holding Corporation
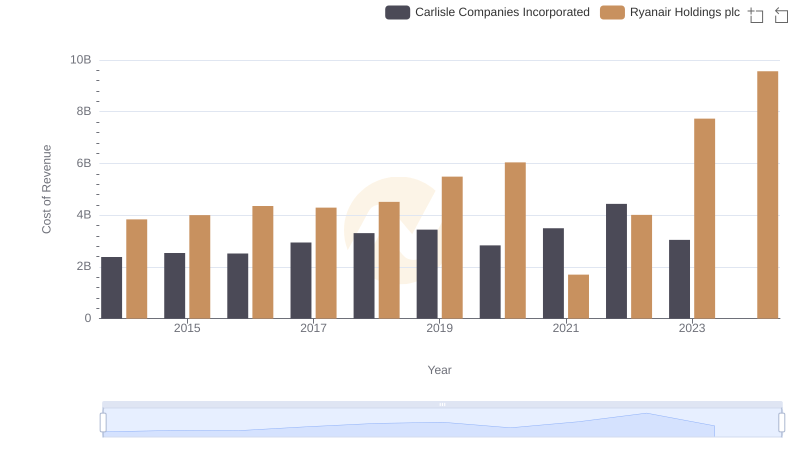
Cost of Revenue Comparison: Ryanair Holdings plc vs Carlisle Companies Incorporated
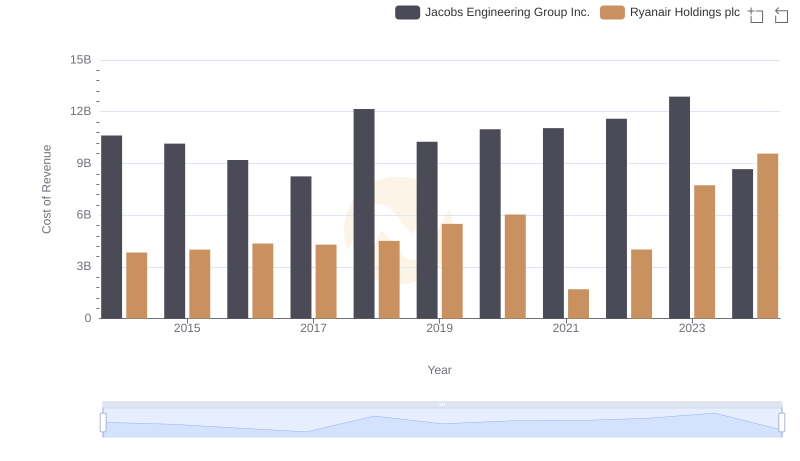
Cost of Revenue: Key Insights for Ryanair Holdings plc and Jacobs Engineering Group Inc.
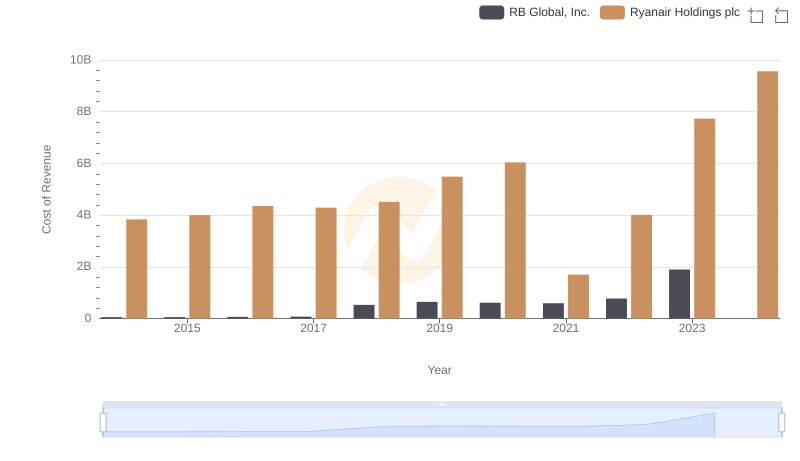
Ryanair Holdings plc vs RB Global, Inc.: Efficiency in Cost of Revenue Explored
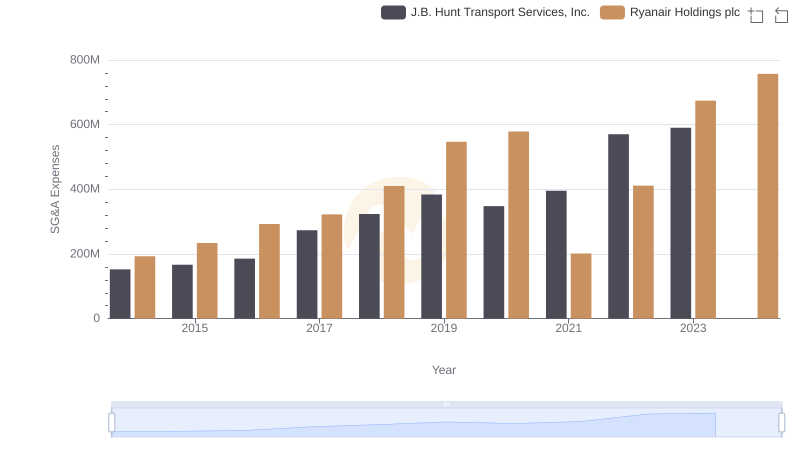
Selling, General, and Administrative Costs: Ryanair Holdings plc vs J.B. Hunt Transport Services, Inc.