| __timestamp | EMCOR Group, Inc. | Ryanair Holdings plc |
|---|---|---|
| Wednesday, January 1, 2014 | 5517719000 | 3838100000 |
| Thursday, January 1, 2015 | 5774247000 | 3999600000 |
| Friday, January 1, 2016 | 6513662000 | 4355900000 |
| Sunday, January 1, 2017 | 6539987000 | 4294000000 |
| Monday, January 1, 2018 | 6925178000 | 4512300000 |
| Tuesday, January 1, 2019 | 7818743000 | 5492800000 |
| Wednesday, January 1, 2020 | 7401679000 | 6039900000 |
| Friday, January 1, 2021 | 8401843000 | 1702700000 |
| Saturday, January 1, 2022 | 9472526000 | 4009800000 |
| Sunday, January 1, 2023 | 10493534000 | 7735000000 |
| Monday, January 1, 2024 | 9566400000 |
In pursuit of knowledge
In the ever-evolving landscape of global business, Ryanair Holdings plc and EMCOR Group, Inc. stand as titans in their respective industries. Over the past decade, from 2014 to 2023, these companies have showcased intriguing trends in their cost of revenue.
Ryanair, a leader in the airline industry, has seen its cost of revenue grow by approximately 150% from 2014 to 2023, reflecting its aggressive expansion and operational strategies. Notably, the year 2021 marked a significant dip, likely due to the global pandemic's impact on air travel. However, by 2023, Ryanair's cost of revenue rebounded to nearly 7.7 billion, showcasing resilience and adaptability.
On the other hand, EMCOR Group, a powerhouse in construction and facilities services, experienced a steady increase, with a 90% rise in cost of revenue over the same period. By 2023, EMCOR's cost of revenue reached an impressive 10.5 billion, underscoring its robust growth trajectory.
These trends highlight the dynamic nature of cost management in different sectors, offering valuable insights for investors and industry analysts alike.
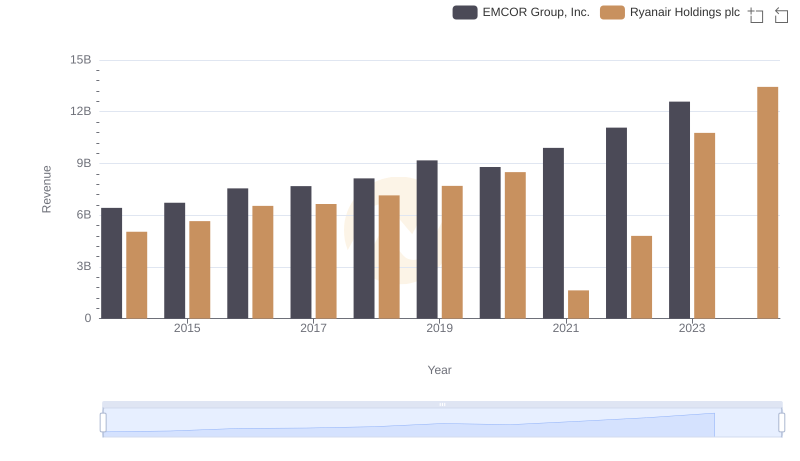
Ryanair Holdings plc vs EMCOR Group, Inc.: Examining Key Revenue Metrics
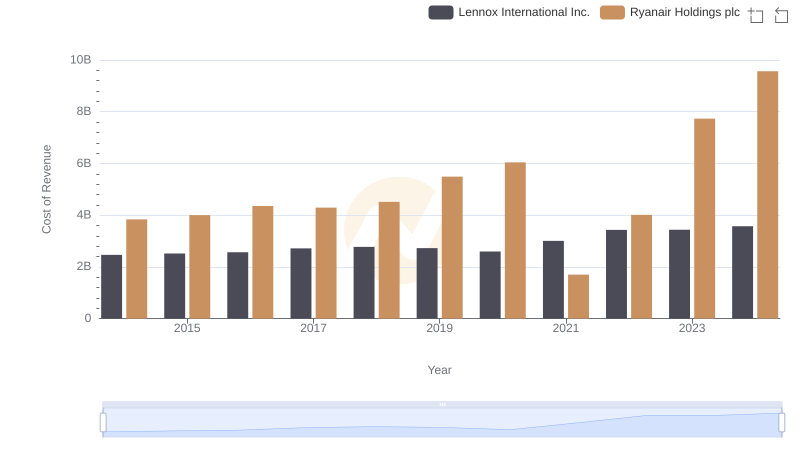
Ryanair Holdings plc vs Lennox International Inc.: Efficiency in Cost of Revenue Explored

Cost of Revenue Trends: Ryanair Holdings plc vs Hubbell Incorporated
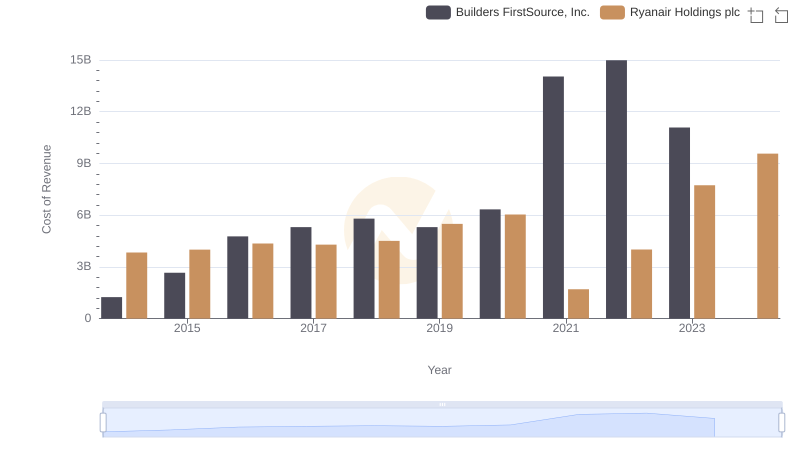
Analyzing Cost of Revenue: Ryanair Holdings plc and Builders FirstSource, Inc.
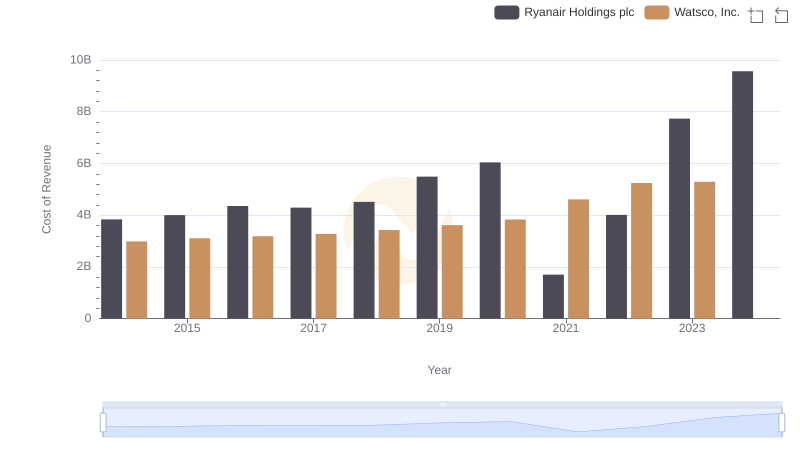
Cost of Revenue Trends: Ryanair Holdings plc vs Watsco, Inc.

Comparing Cost of Revenue Efficiency: Ryanair Holdings plc vs Southwest Airlines Co.
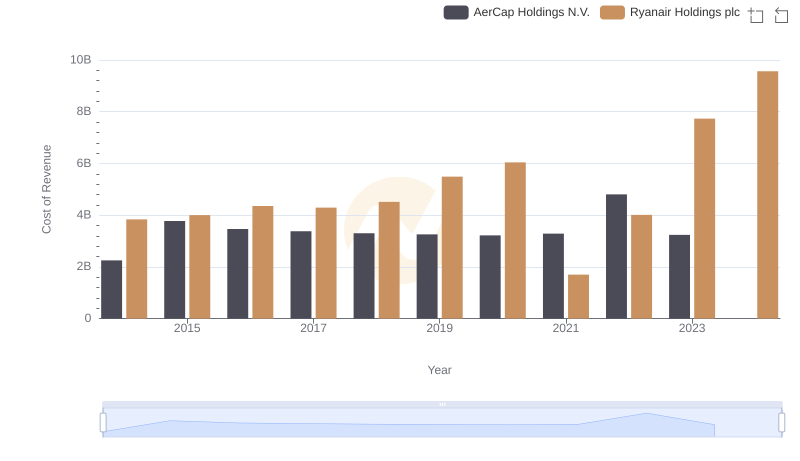
Cost of Revenue: Key Insights for Ryanair Holdings plc and AerCap Holdings N.V.
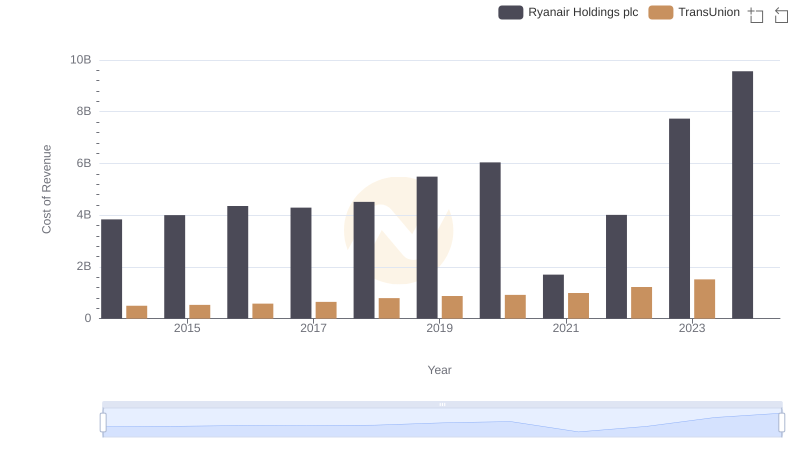
Ryanair Holdings plc vs TransUnion: Efficiency in Cost of Revenue Explored
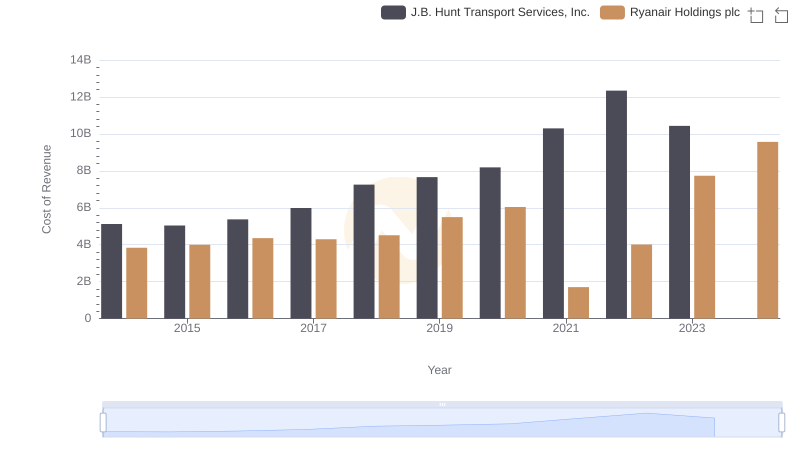
Ryanair Holdings plc vs J.B. Hunt Transport Services, Inc.: Efficiency in Cost of Revenue Explored
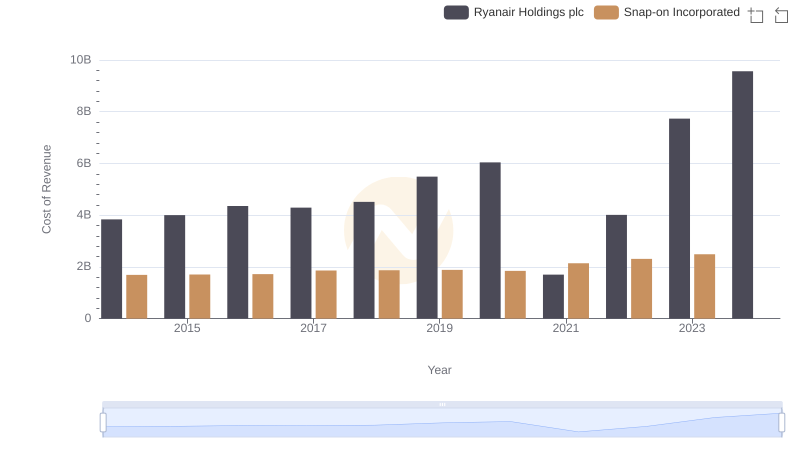
Comparing Cost of Revenue Efficiency: Ryanair Holdings plc vs Snap-on Incorporated
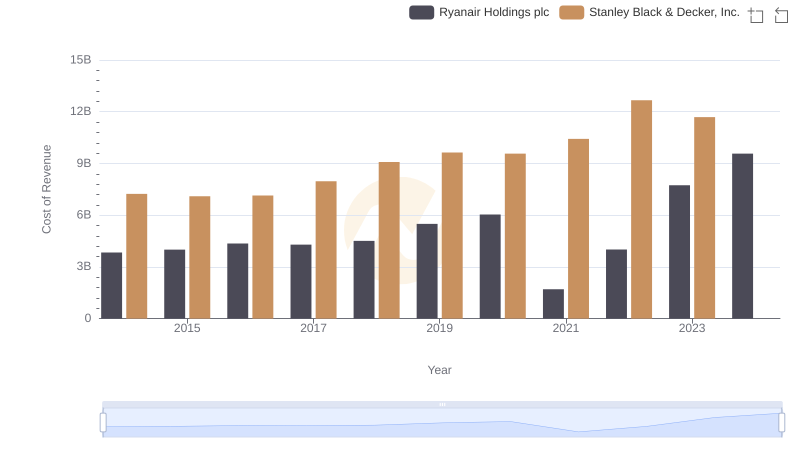
Cost of Revenue Trends: Ryanair Holdings plc vs Stanley Black & Decker, Inc.