| __timestamp | Hubbell Incorporated | Ryanair Holdings plc |
|---|---|---|
| Wednesday, January 1, 2014 | 3359400000 | 5036700000 |
| Thursday, January 1, 2015 | 3390400000 | 5654000000 |
| Friday, January 1, 2016 | 3505200000 | 6535800000 |
| Sunday, January 1, 2017 | 3668800000 | 6647800000 |
| Monday, January 1, 2018 | 4481700000 | 7151000000 |
| Tuesday, January 1, 2019 | 4591000000 | 7697400000 |
| Wednesday, January 1, 2020 | 4186000000 | 8494799999 |
| Friday, January 1, 2021 | 4194100000 | 1635800000 |
| Saturday, January 1, 2022 | 4947900000 | 4800900000 |
| Sunday, January 1, 2023 | 5372900000 | 10775200000 |
| Monday, January 1, 2024 | 5628500000 | 13443800000 |
Unveiling the hidden dimensions of data
In the ever-evolving landscape of global business, Ryanair Holdings plc and Hubbell Incorporated stand as intriguing examples of contrasting growth trajectories. From 2014 to 2023, Ryanair's revenue soared by approximately 114%, showcasing its resilience and adaptability in the competitive airline industry. In contrast, Hubbell, a stalwart in the electrical products sector, experienced a steady growth of around 60% over the same period.
This comparison highlights the dynamic nature of business growth, influenced by industry-specific challenges and opportunities.
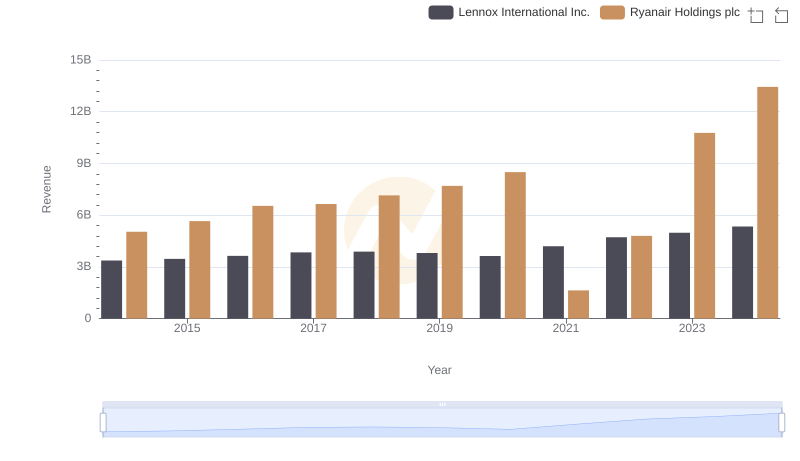
Annual Revenue Comparison: Ryanair Holdings plc vs Lennox International Inc.
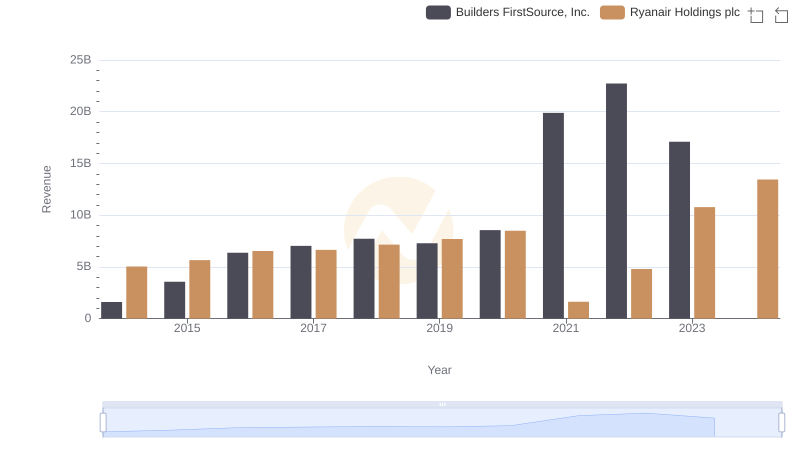
Breaking Down Revenue Trends: Ryanair Holdings plc vs Builders FirstSource, Inc.
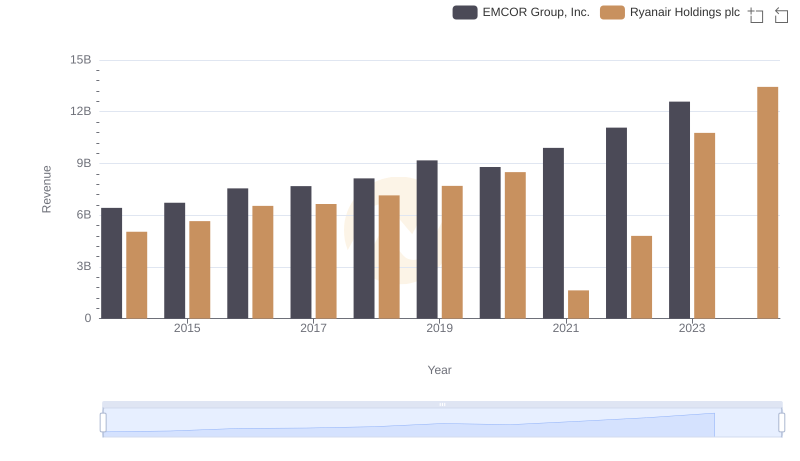
Ryanair Holdings plc vs EMCOR Group, Inc.: Examining Key Revenue Metrics

Cost of Revenue Trends: Ryanair Holdings plc vs Hubbell Incorporated
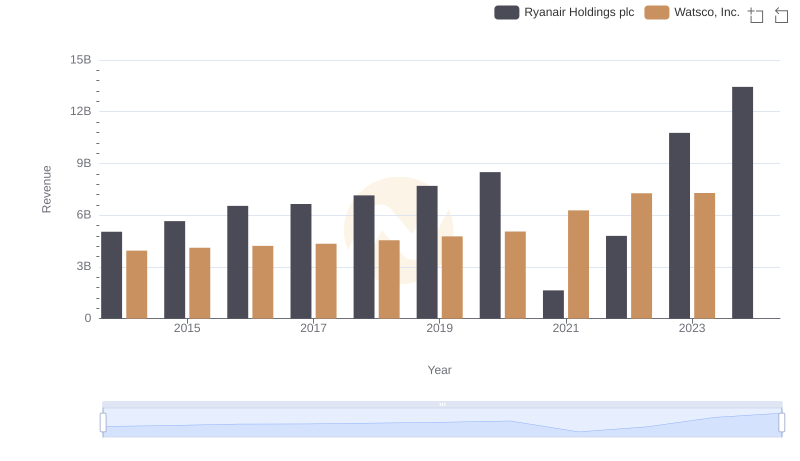
Breaking Down Revenue Trends: Ryanair Holdings plc vs Watsco, Inc.
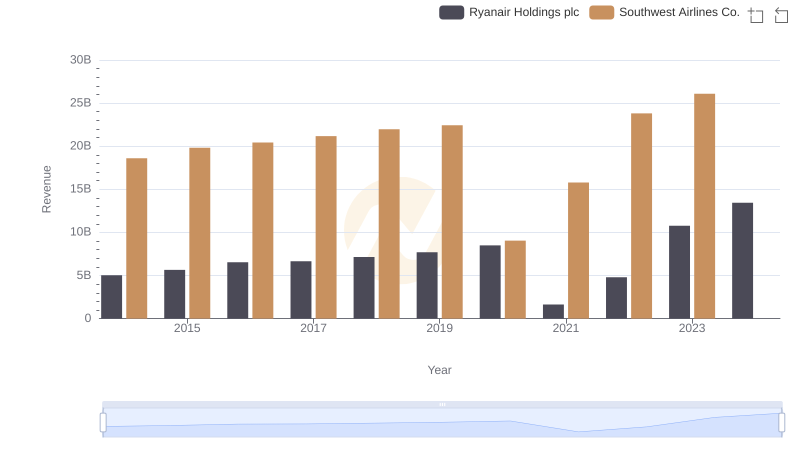
Ryanair Holdings plc vs Southwest Airlines Co.: Annual Revenue Growth Compared
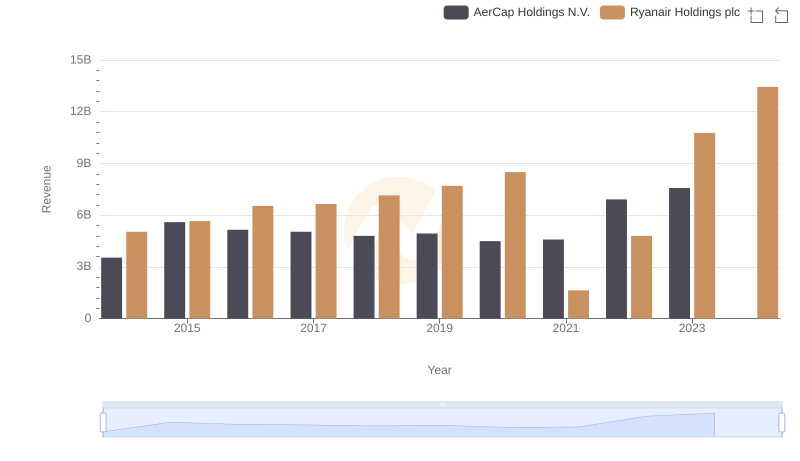
Revenue Showdown: Ryanair Holdings plc vs AerCap Holdings N.V.
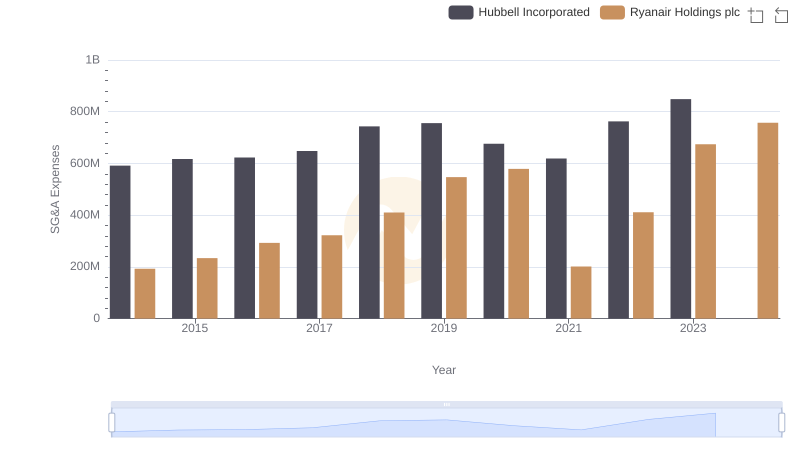
Operational Costs Compared: SG&A Analysis of Ryanair Holdings plc and Hubbell Incorporated
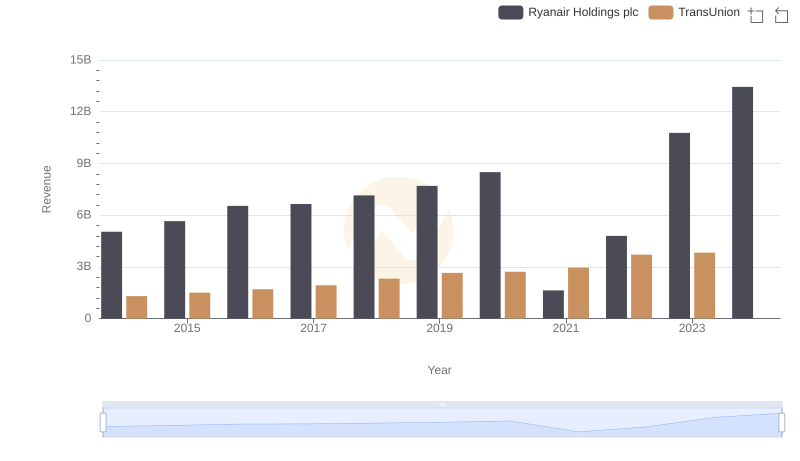
Ryanair Holdings plc or TransUnion: Who Leads in Yearly Revenue?
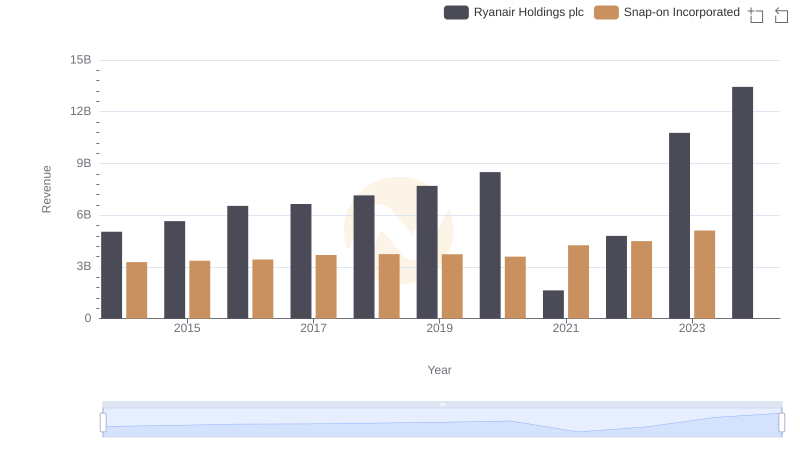
Ryanair Holdings plc vs Snap-on Incorporated: Examining Key Revenue Metrics
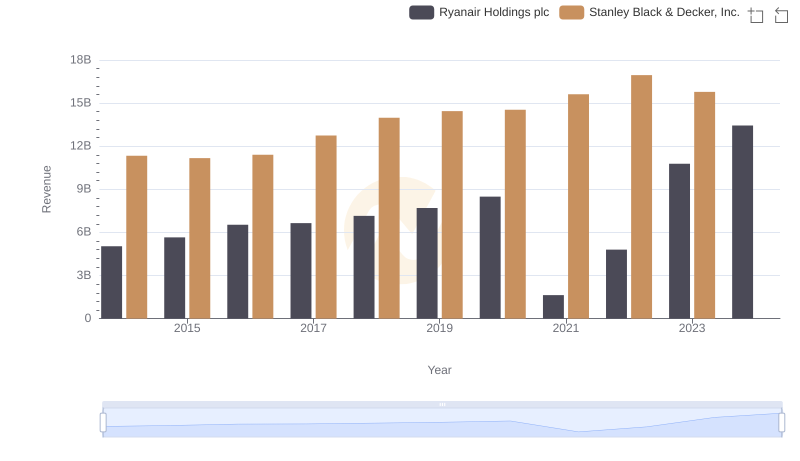
Annual Revenue Comparison: Ryanair Holdings plc vs Stanley Black & Decker, Inc.
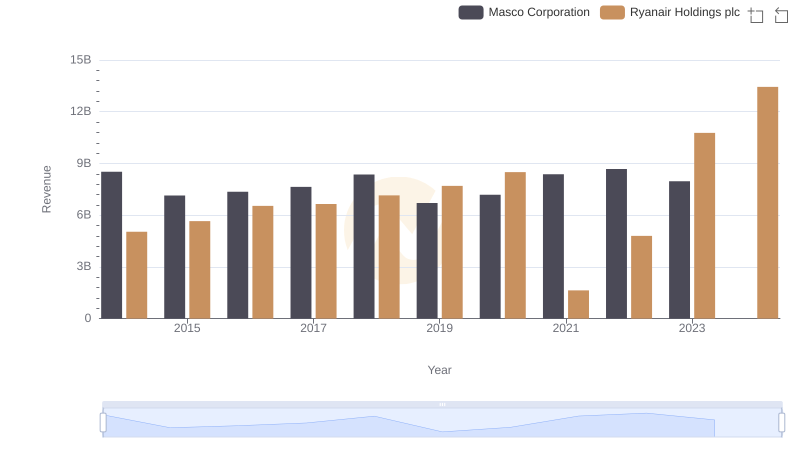
Revenue Insights: Ryanair Holdings plc and Masco Corporation Performance Compared