| __timestamp | AerCap Holdings N.V. | Ryanair Holdings plc |
|---|---|---|
| Wednesday, January 1, 2014 | 2252878000 | 3838100000 |
| Thursday, January 1, 2015 | 3776407000 | 3999600000 |
| Friday, January 1, 2016 | 3465727000 | 4355900000 |
| Sunday, January 1, 2017 | 3377439000 | 4294000000 |
| Monday, January 1, 2018 | 3299635000 | 4512300000 |
| Tuesday, January 1, 2019 | 3259091000 | 5492800000 |
| Wednesday, January 1, 2020 | 3217133000 | 6039900000 |
| Friday, January 1, 2021 | 3287413000 | 1702700000 |
| Saturday, January 1, 2022 | 4805277000 | 4009800000 |
| Sunday, January 1, 2023 | 3237016000 | 7735000000 |
| Monday, January 1, 2024 | 9566400000 |
Unlocking the unknown
In the competitive landscape of aviation, understanding cost structures is crucial. Ryanair Holdings plc and AerCap Holdings N.V. have shown distinct trends in their cost of revenue from 2014 to 2023. Ryanair's cost of revenue surged by approximately 150% over this period, peaking in 2023. This reflects its aggressive expansion and operational strategies. In contrast, AerCap's costs remained relatively stable, with a notable spike in 2022, suggesting strategic investments or market shifts. The data highlights Ryanair's resilience, especially post-2020, where it rebounded from a significant dip. Meanwhile, AerCap's consistent cost management underscores its steady approach. Missing data for AerCap in 2024 suggests potential reporting delays or strategic shifts. These insights offer a window into the financial dynamics of two major players in the aviation sector, providing valuable context for investors and industry analysts.
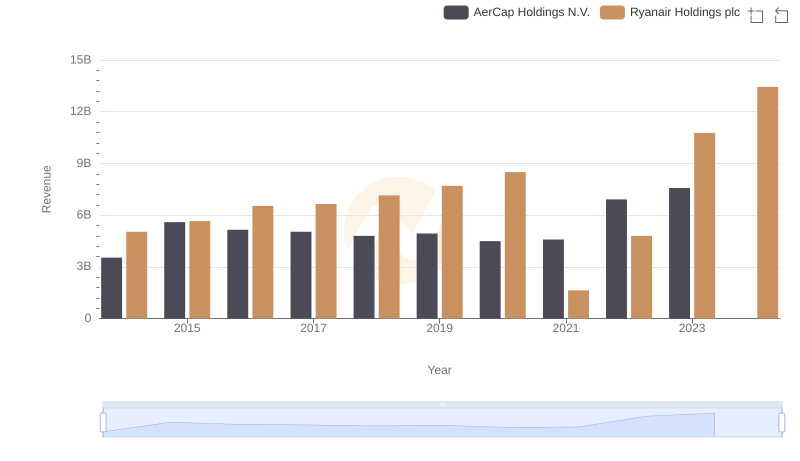
Revenue Showdown: Ryanair Holdings plc vs AerCap Holdings N.V.
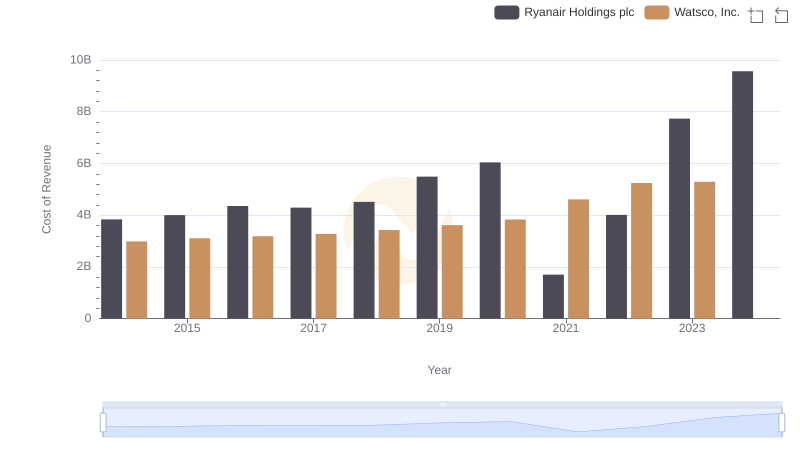
Cost of Revenue Trends: Ryanair Holdings plc vs Watsco, Inc.

Comparing Cost of Revenue Efficiency: Ryanair Holdings plc vs Southwest Airlines Co.
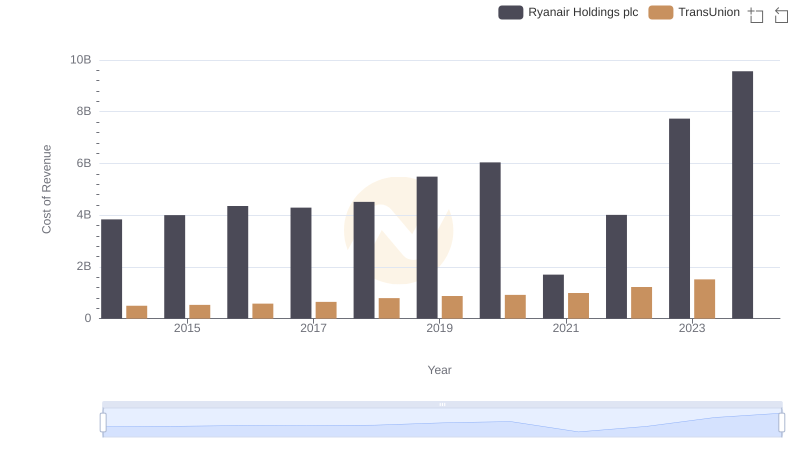
Ryanair Holdings plc vs TransUnion: Efficiency in Cost of Revenue Explored
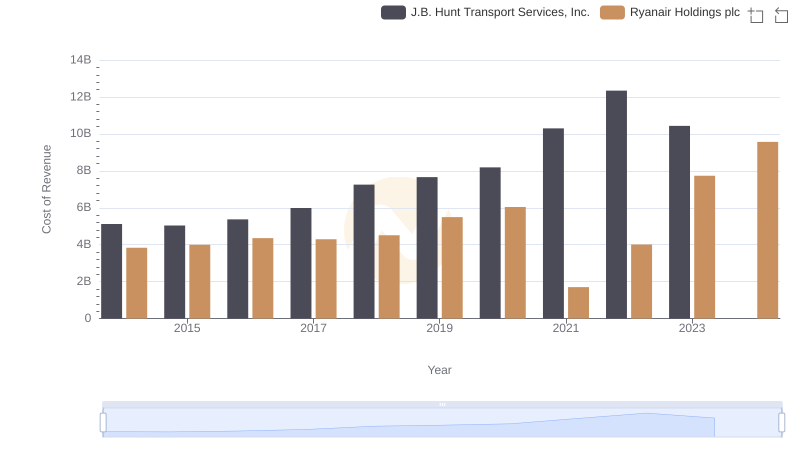
Ryanair Holdings plc vs J.B. Hunt Transport Services, Inc.: Efficiency in Cost of Revenue Explored
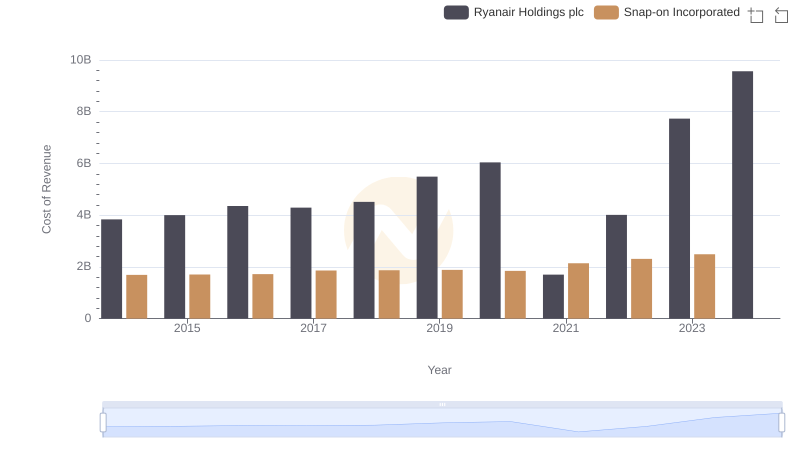
Comparing Cost of Revenue Efficiency: Ryanair Holdings plc vs Snap-on Incorporated
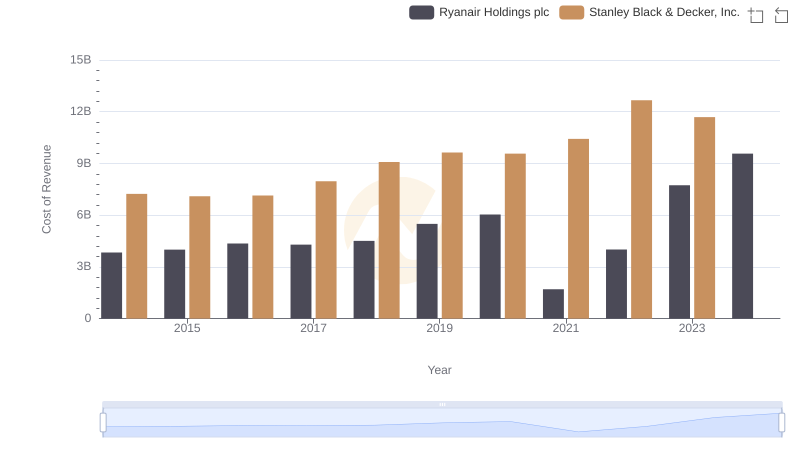
Cost of Revenue Trends: Ryanair Holdings plc vs Stanley Black & Decker, Inc.
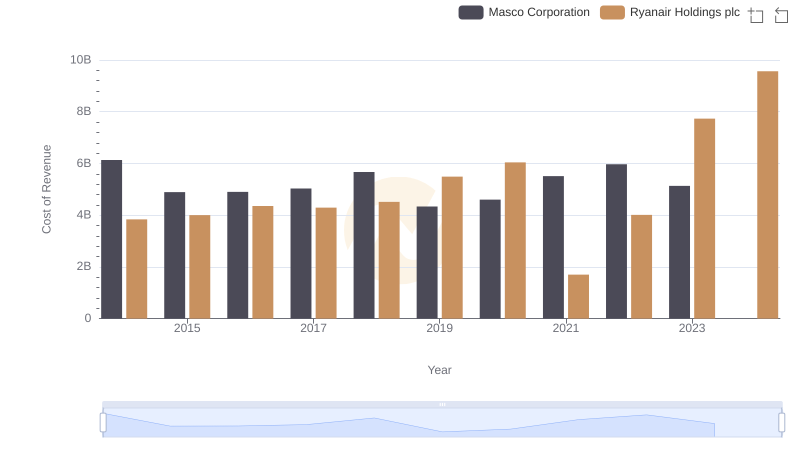
Cost of Revenue Trends: Ryanair Holdings plc vs Masco Corporation
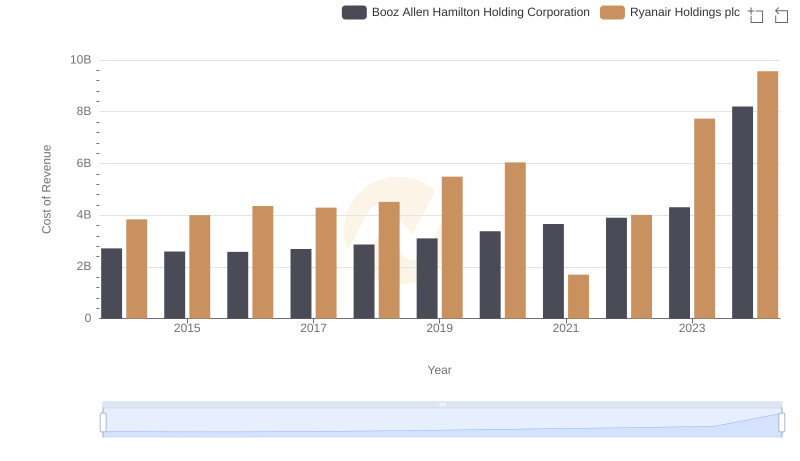
Comparing Cost of Revenue Efficiency: Ryanair Holdings plc vs Booz Allen Hamilton Holding Corporation
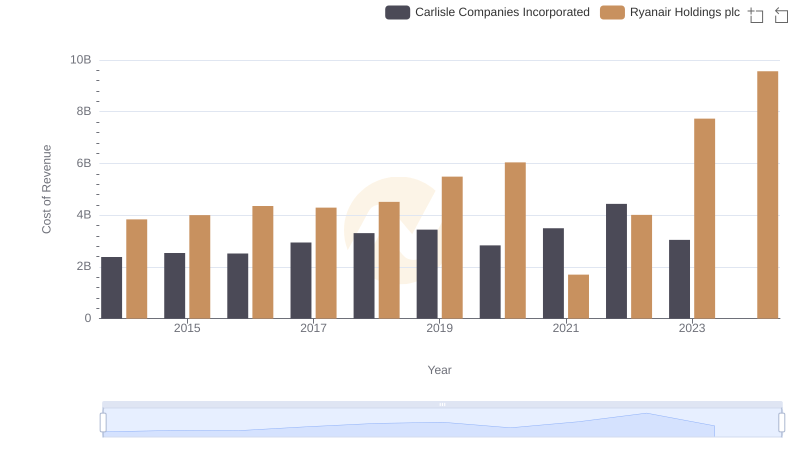
Cost of Revenue Comparison: Ryanair Holdings plc vs Carlisle Companies Incorporated
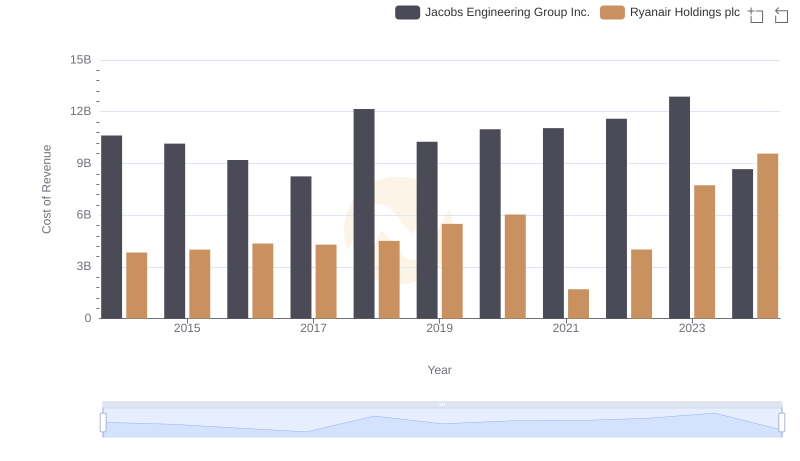
Cost of Revenue: Key Insights for Ryanair Holdings plc and Jacobs Engineering Group Inc.
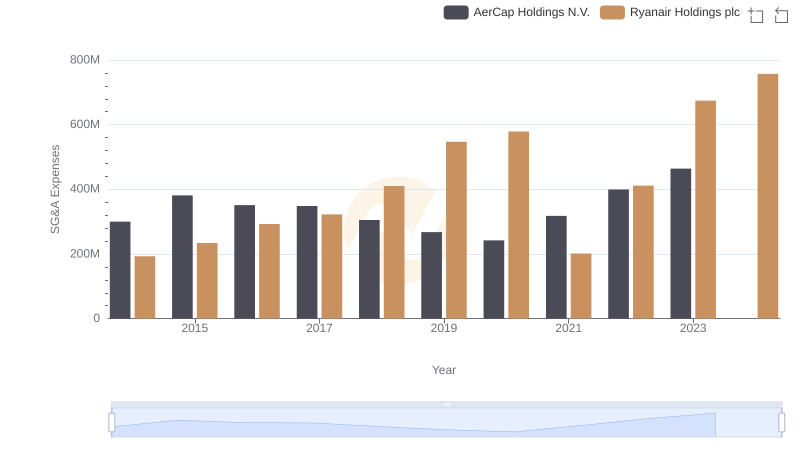
Ryanair Holdings plc and AerCap Holdings N.V.: SG&A Spending Patterns Compared