| __timestamp | ITT Inc. | Rockwell Automation, Inc. |
|---|---|---|
| Wednesday, January 1, 2014 | 2654600000 | 6623500000 |
| Thursday, January 1, 2015 | 2485600000 | 6307900000 |
| Friday, January 1, 2016 | 2405400000 | 5879500000 |
| Sunday, January 1, 2017 | 2585300000 | 6311300000 |
| Monday, January 1, 2018 | 2745100000 | 6666000000 |
| Tuesday, January 1, 2019 | 2846400000 | 6694800000 |
| Wednesday, January 1, 2020 | 2477800000 | 6329800000 |
| Friday, January 1, 2021 | 2765000000 | 6997400000 |
| Saturday, January 1, 2022 | 2987700000 | 7760400000 |
| Sunday, January 1, 2023 | 3283000000 | 9058000000 |
| Monday, January 1, 2024 | 3630700000 | 8264200000 |
Unveiling the hidden dimensions of data
In the ever-evolving landscape of industrial automation and engineering, Rockwell Automation and ITT Inc. have been pivotal players. Over the past decade, Rockwell Automation has consistently outperformed ITT Inc. in terms of revenue. From 2014 to 2023, Rockwell's revenue surged by approximately 37%, peaking at $9.06 billion in 2023. In contrast, ITT Inc. experienced a more modest growth of around 24%, reaching $3.28 billion in the same year.
Rockwell Automation's revenue trajectory highlights its robust market position, with a steady increase each year, except for a slight dip in 2016. ITT Inc., while showing resilience, faced more fluctuations, particularly between 2015 and 2017. The data for 2024 is incomplete, but Rockwell's consistent performance suggests a promising outlook.
This comparison underscores the dynamic nature of the industrial sector, where strategic innovation and market adaptation are key to sustained growth.
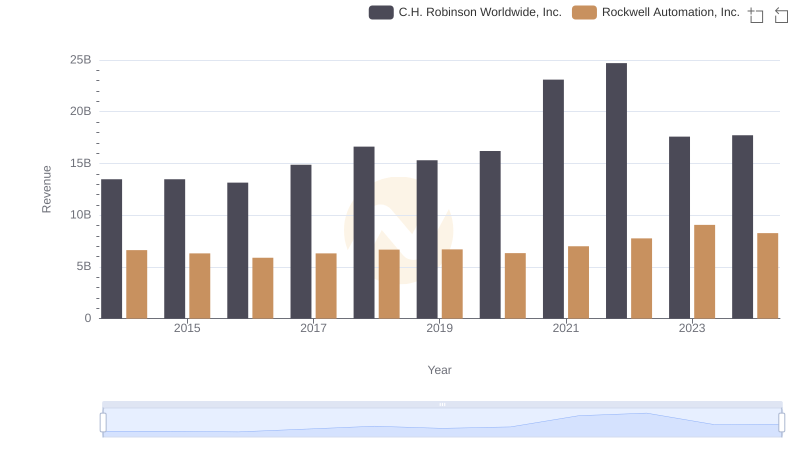
Rockwell Automation, Inc. vs C.H. Robinson Worldwide, Inc.: Annual Revenue Growth Compared
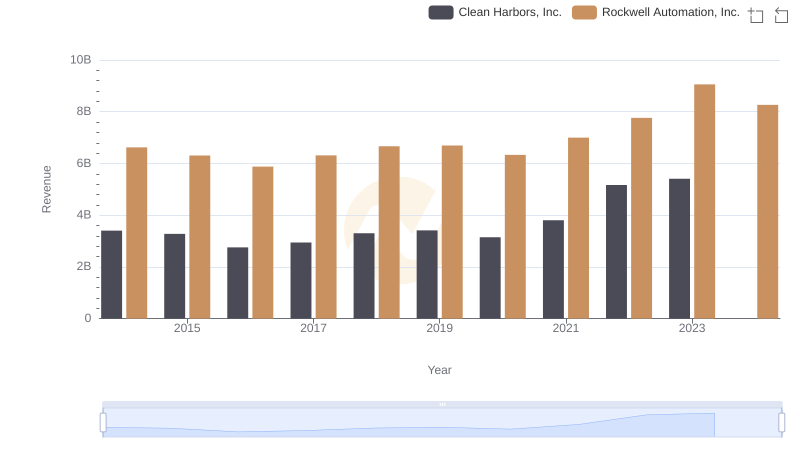
Comparing Revenue Performance: Rockwell Automation, Inc. or Clean Harbors, Inc.?
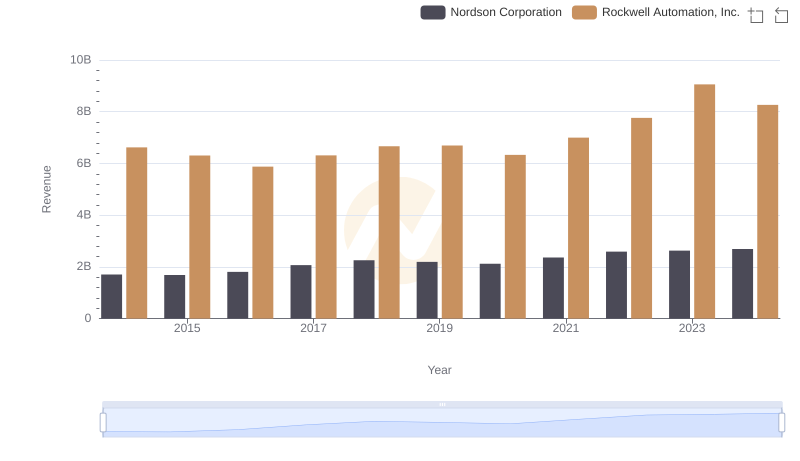
Annual Revenue Comparison: Rockwell Automation, Inc. vs Nordson Corporation
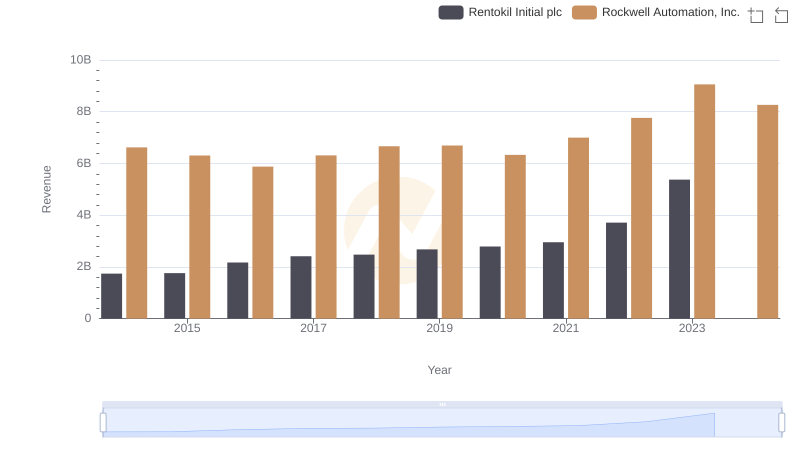
Rockwell Automation, Inc. vs Rentokil Initial plc: Examining Key Revenue Metrics
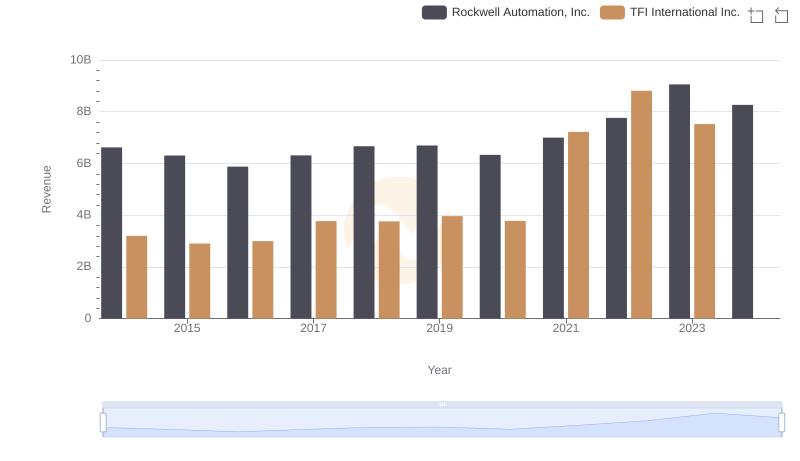
Breaking Down Revenue Trends: Rockwell Automation, Inc. vs TFI International Inc.
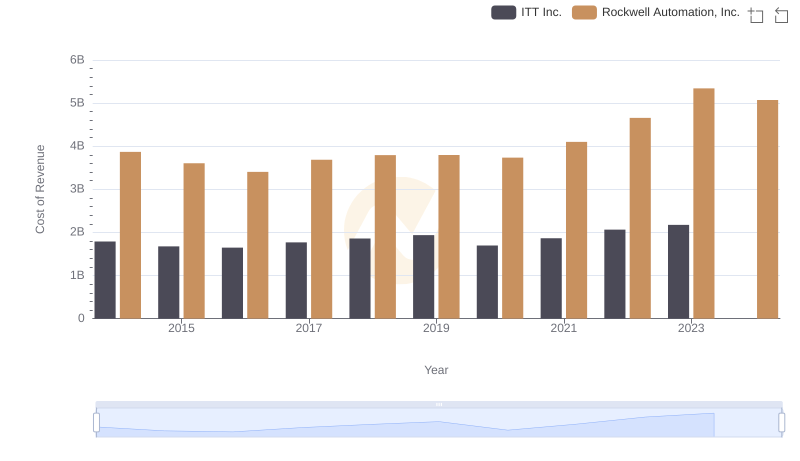
Cost of Revenue Trends: Rockwell Automation, Inc. vs ITT Inc.
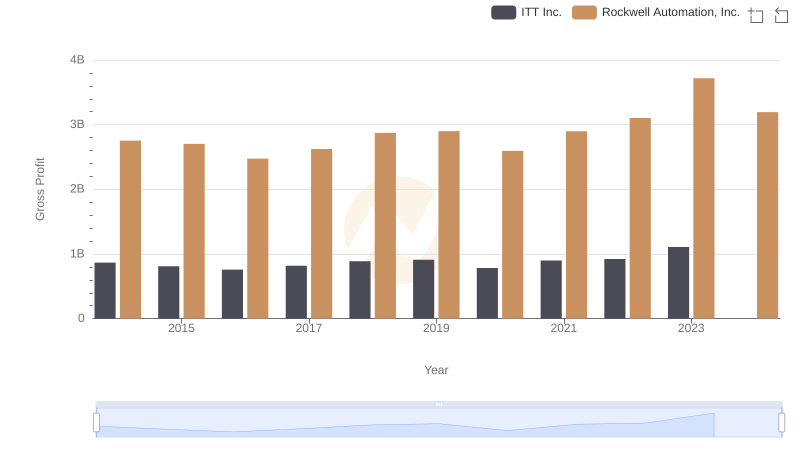
Gross Profit Comparison: Rockwell Automation, Inc. and ITT Inc. Trends
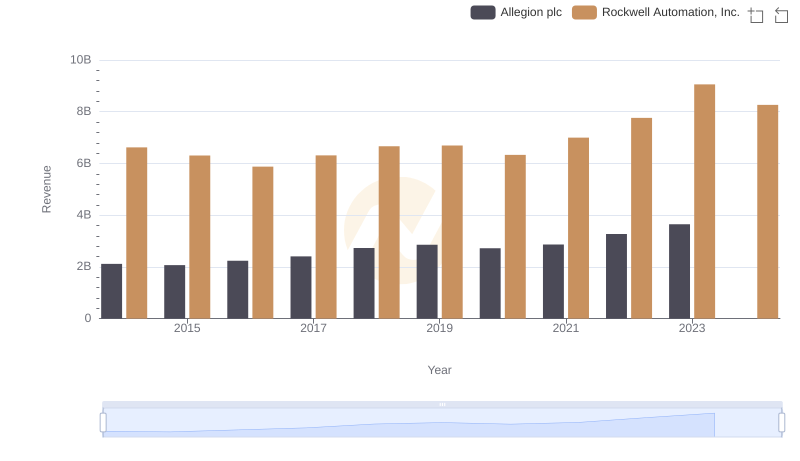
Comparing Revenue Performance: Rockwell Automation, Inc. or Allegion plc?
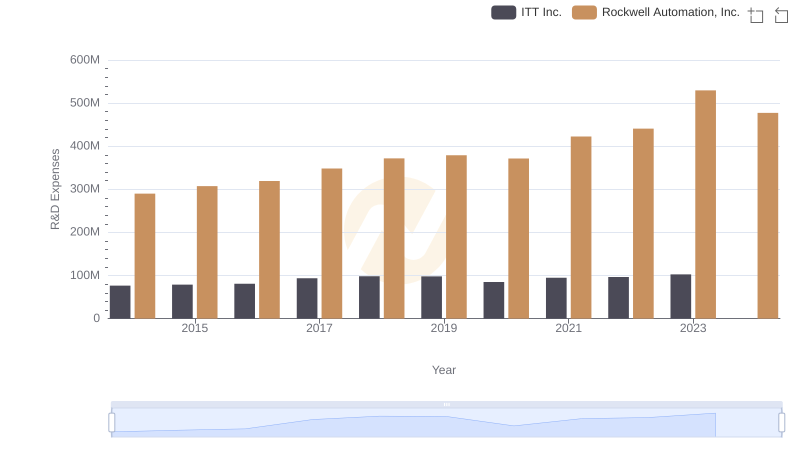
Research and Development: Comparing Key Metrics for Rockwell Automation, Inc. and ITT Inc.
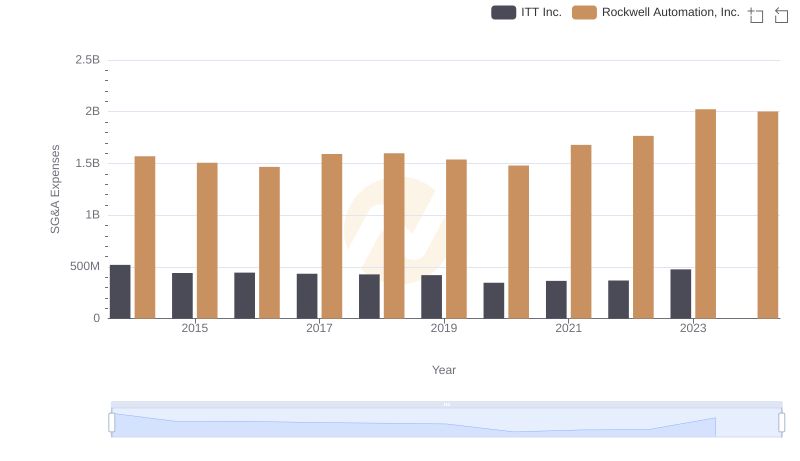
Rockwell Automation, Inc. and ITT Inc.: SG&A Spending Patterns Compared
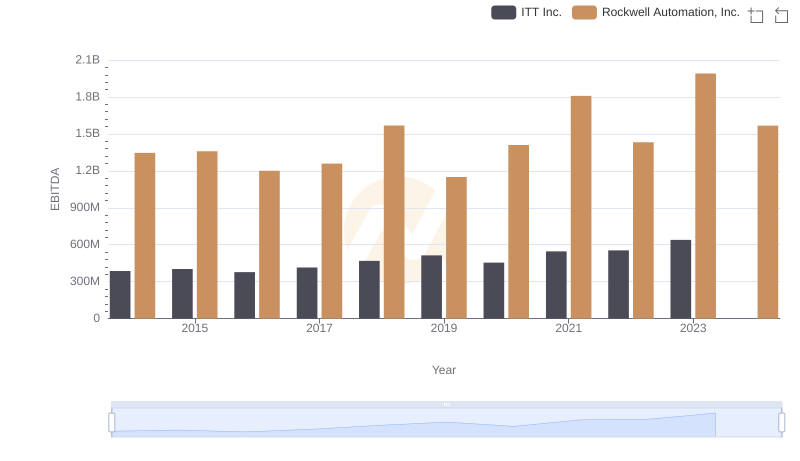
Rockwell Automation, Inc. vs ITT Inc.: In-Depth EBITDA Performance Comparison