| __timestamp | ITT Inc. | Rockwell Automation, Inc. |
|---|---|---|
| Wednesday, January 1, 2014 | 519500000 | 1570100000 |
| Thursday, January 1, 2015 | 441500000 | 1506400000 |
| Friday, January 1, 2016 | 444100000 | 1467400000 |
| Sunday, January 1, 2017 | 433700000 | 1591500000 |
| Monday, January 1, 2018 | 427300000 | 1599000000 |
| Tuesday, January 1, 2019 | 420000000 | 1538500000 |
| Wednesday, January 1, 2020 | 347200000 | 1479800000 |
| Friday, January 1, 2021 | 365100000 | 1680000000 |
| Saturday, January 1, 2022 | 368500000 | 1766700000 |
| Sunday, January 1, 2023 | 476600000 | 2023700000 |
| Monday, January 1, 2024 | 502300000 | 2002600000 |
Unveiling the hidden dimensions of data
In the competitive landscape of industrial automation and engineering, understanding spending patterns can reveal much about a company's strategic priorities. Rockwell Automation, Inc. and ITT Inc. have shown distinct trends in their Selling, General, and Administrative (SG&A) expenses over the past decade.
From 2014 to 2023, Rockwell Automation's SG&A expenses have consistently outpaced those of ITT Inc., with Rockwell's spending peaking at over 2 billion in 2023, marking a 29% increase from 2014. In contrast, ITT Inc.'s expenses peaked in 2014 and have since fluctuated, showing a 9% decrease by 2023.
These trends suggest Rockwell's aggressive investment in growth and market expansion, while ITT Inc. appears to be optimizing its operational efficiency. The data for 2024 is incomplete, leaving room for speculation on future strategies.
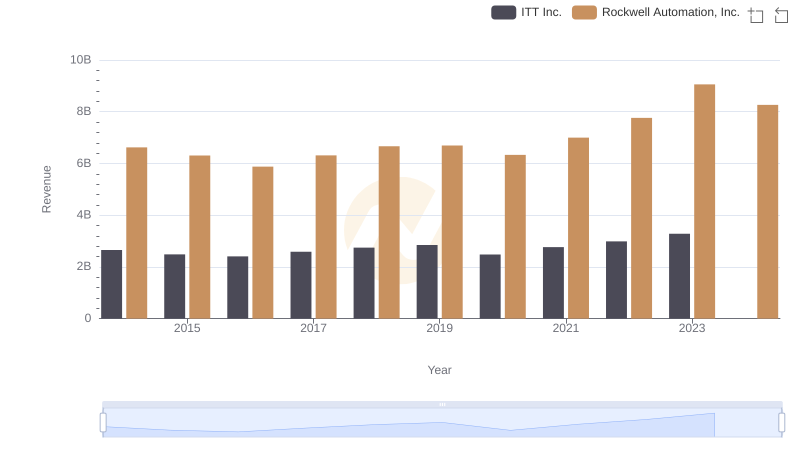
Comparing Revenue Performance: Rockwell Automation, Inc. or ITT Inc.?
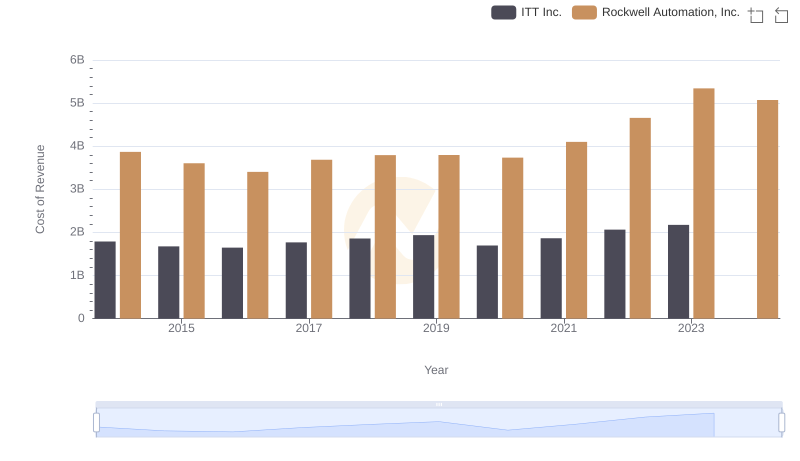
Cost of Revenue Trends: Rockwell Automation, Inc. vs ITT Inc.
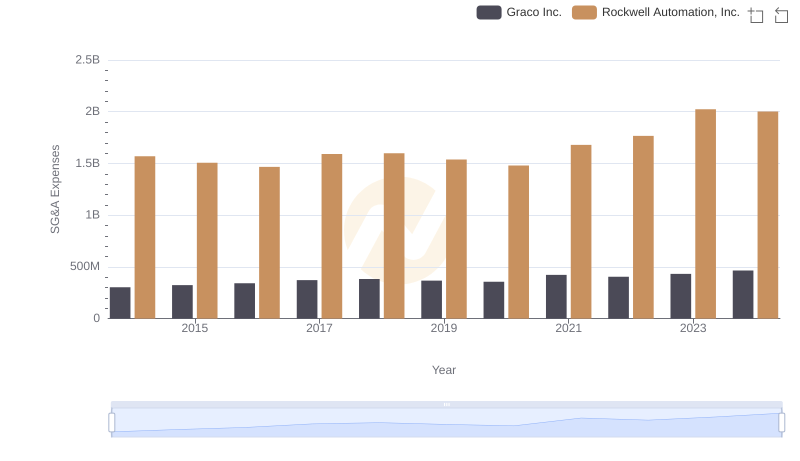
Rockwell Automation, Inc. and Graco Inc.: SG&A Spending Patterns Compared
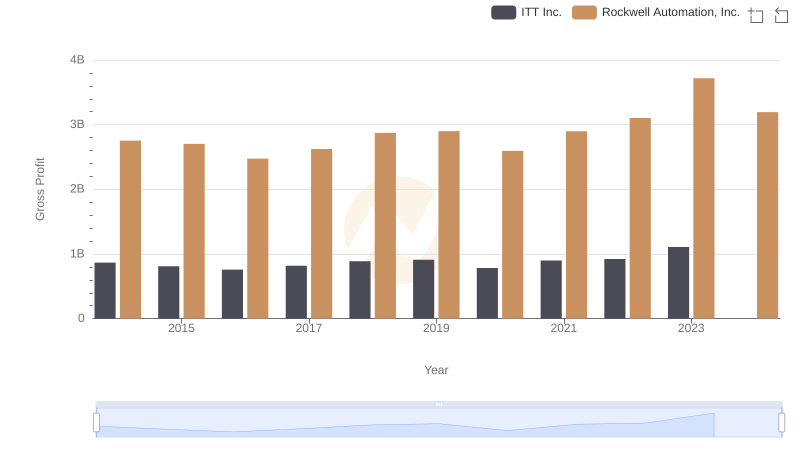
Gross Profit Comparison: Rockwell Automation, Inc. and ITT Inc. Trends
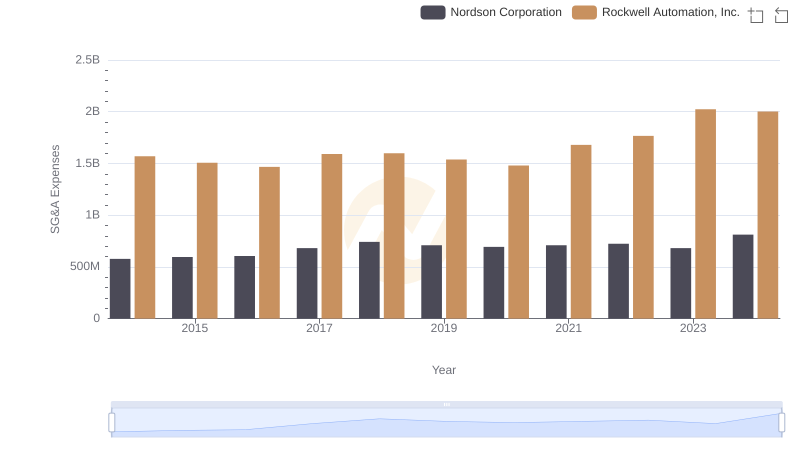
Selling, General, and Administrative Costs: Rockwell Automation, Inc. vs Nordson Corporation
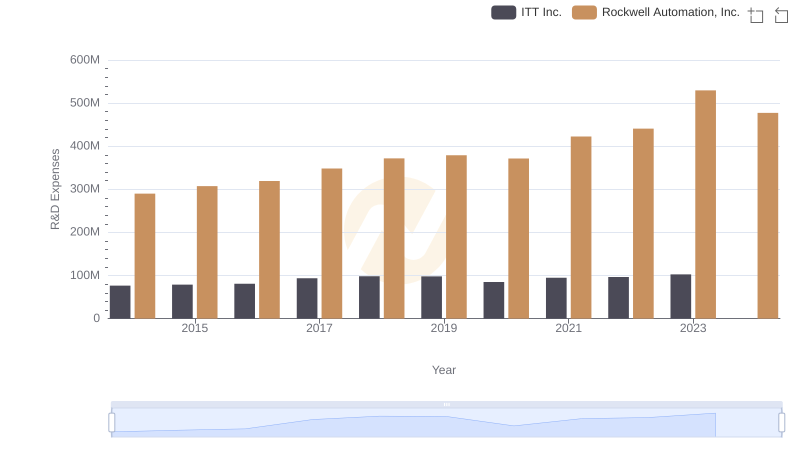
Research and Development: Comparing Key Metrics for Rockwell Automation, Inc. and ITT Inc.
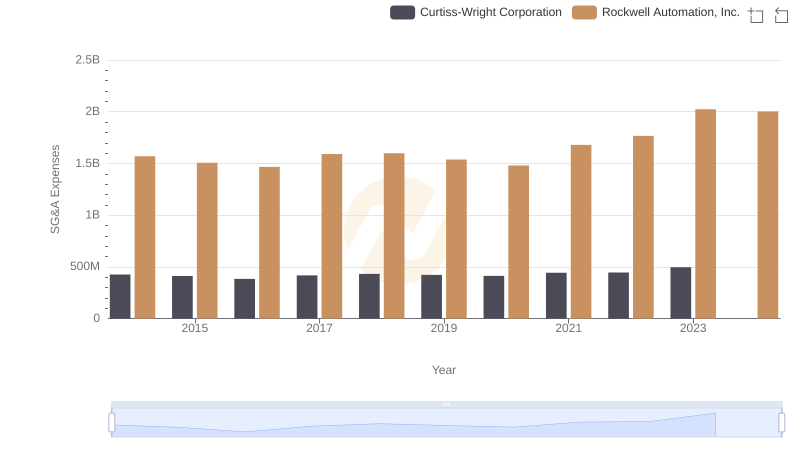
Comparing SG&A Expenses: Rockwell Automation, Inc. vs Curtiss-Wright Corporation Trends and Insights
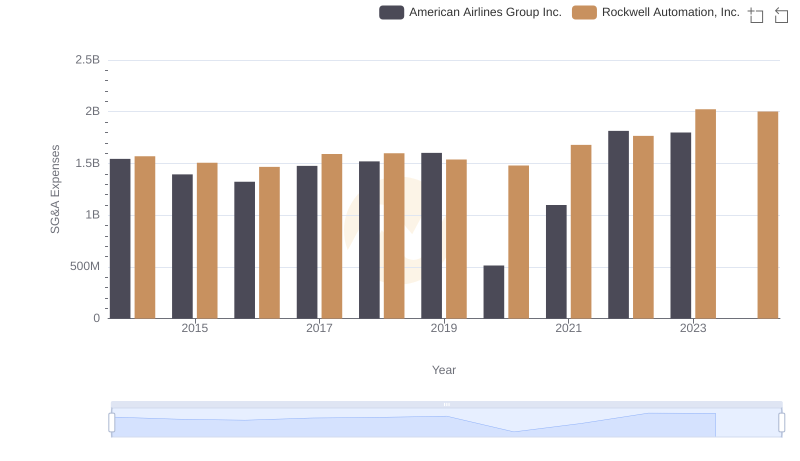
Rockwell Automation, Inc. vs American Airlines Group Inc.: SG&A Expense Trends
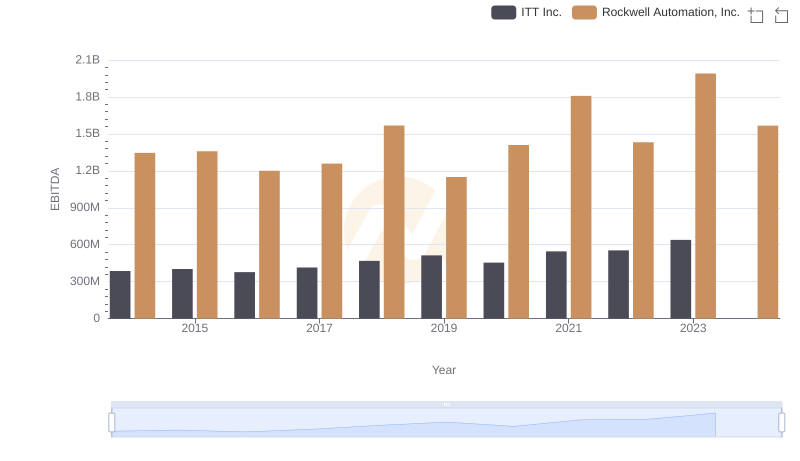
Rockwell Automation, Inc. vs ITT Inc.: In-Depth EBITDA Performance Comparison
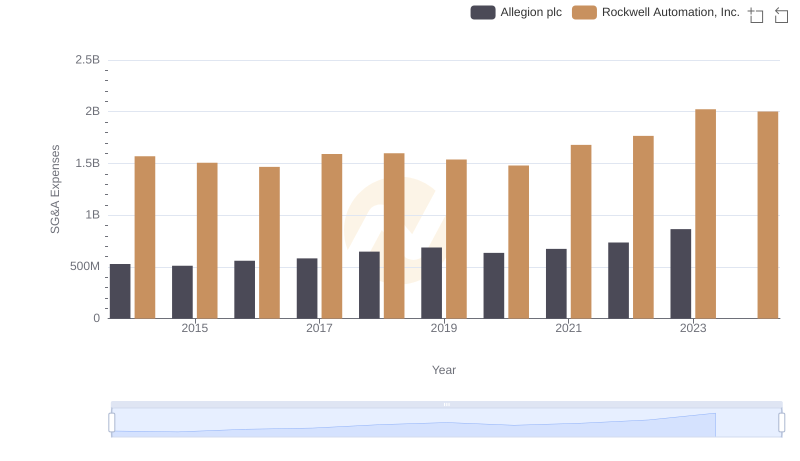
Breaking Down SG&A Expenses: Rockwell Automation, Inc. vs Allegion plc