| __timestamp | ITT Inc. | Rockwell Automation, Inc. |
|---|---|---|
| Wednesday, January 1, 2014 | 866400000 | 2753900000 |
| Thursday, January 1, 2015 | 809100000 | 2703100000 |
| Friday, January 1, 2016 | 758200000 | 2475500000 |
| Sunday, January 1, 2017 | 817200000 | 2624200000 |
| Monday, January 1, 2018 | 887200000 | 2872200000 |
| Tuesday, January 1, 2019 | 910100000 | 2900100000 |
| Wednesday, January 1, 2020 | 782200000 | 2595200000 |
| Friday, January 1, 2021 | 899500000 | 2897700000 |
| Saturday, January 1, 2022 | 922300000 | 3102000000 |
| Sunday, January 1, 2023 | 1107300000 | 3717000000 |
| Monday, January 1, 2024 | 1247300000 | 3193400000 |
Infusing magic into the data realm
In the ever-evolving landscape of industrial automation and engineering, Rockwell Automation, Inc. and ITT Inc. have been pivotal players. Over the past decade, Rockwell Automation has consistently outperformed ITT Inc. in terms of gross profit. From 2014 to 2023, Rockwell Automation's gross profit surged by approximately 35%, peaking at $3.7 billion in 2023. In contrast, ITT Inc. experienced a more modest growth of around 28%, reaching its highest gross profit of $1.1 billion in the same year.
The data reveals a steady upward trajectory for both companies, with Rockwell Automation maintaining a significant lead. Notably, 2023 marked a record year for both, despite the absence of data for ITT Inc. in 2024. This trend underscores the resilience and strategic prowess of these industry giants in navigating market challenges and capitalizing on growth opportunities.
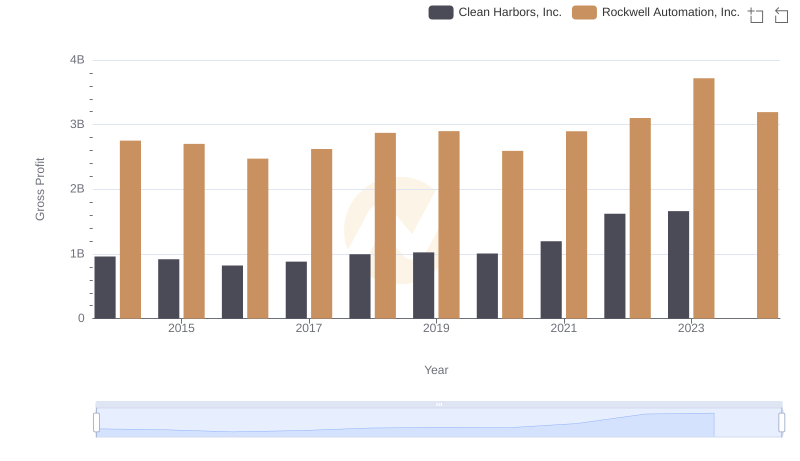
Rockwell Automation, Inc. vs Clean Harbors, Inc.: A Gross Profit Performance Breakdown
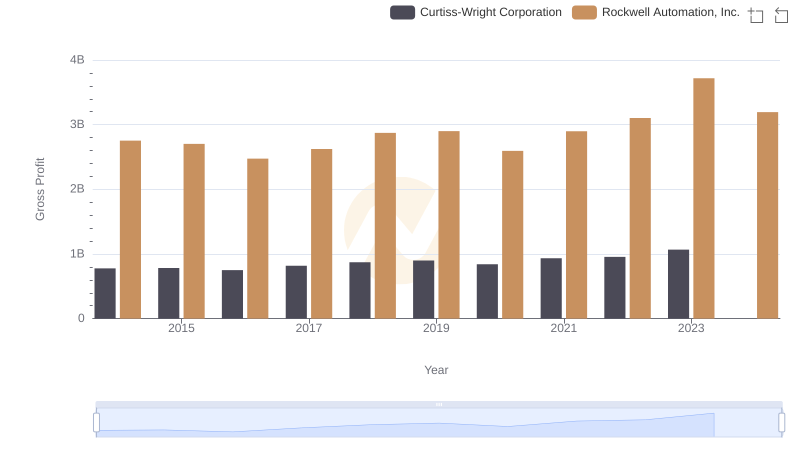
Rockwell Automation, Inc. and Curtiss-Wright Corporation: A Detailed Gross Profit Analysis
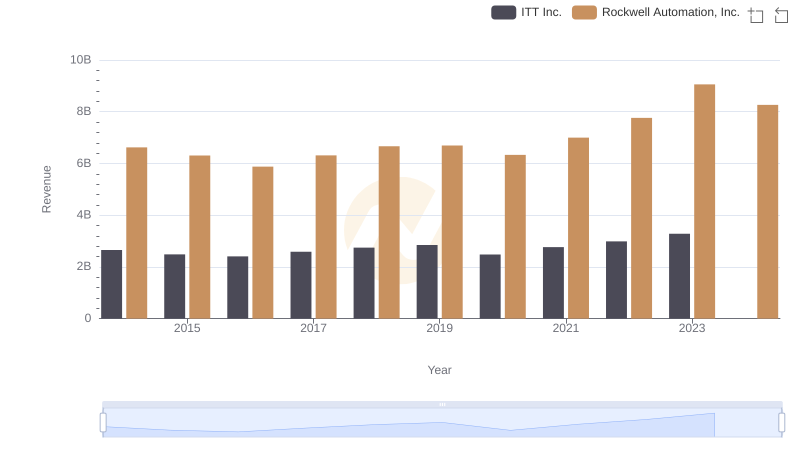
Comparing Revenue Performance: Rockwell Automation, Inc. or ITT Inc.?
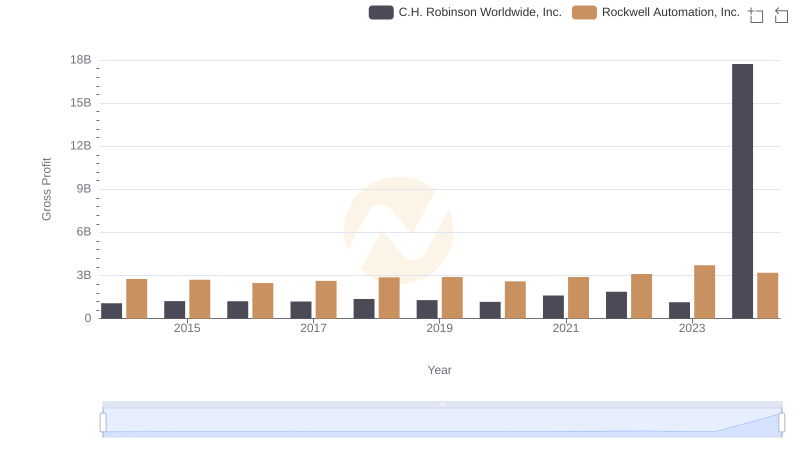
Key Insights on Gross Profit: Rockwell Automation, Inc. vs C.H. Robinson Worldwide, Inc.
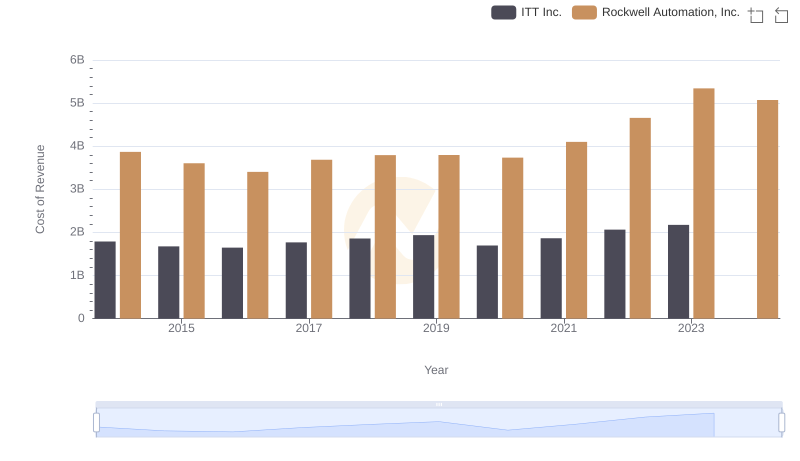
Cost of Revenue Trends: Rockwell Automation, Inc. vs ITT Inc.
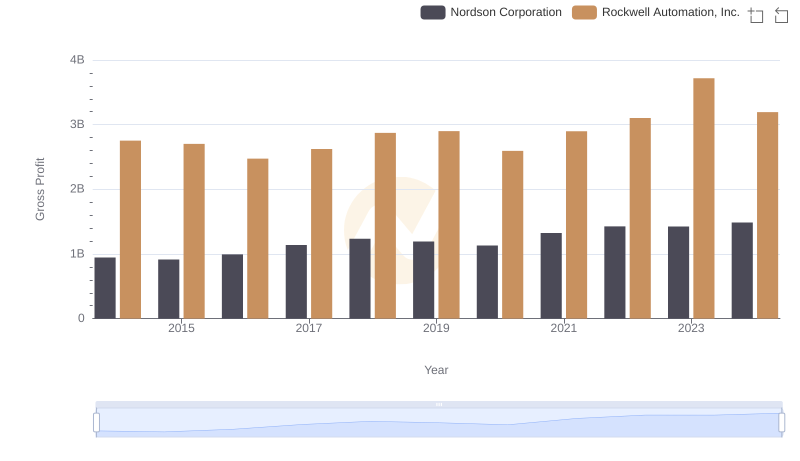
Gross Profit Analysis: Comparing Rockwell Automation, Inc. and Nordson Corporation
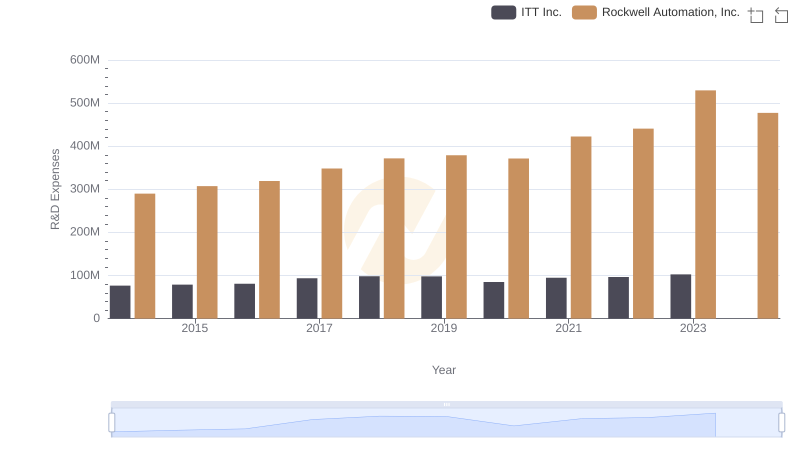
Research and Development: Comparing Key Metrics for Rockwell Automation, Inc. and ITT Inc.
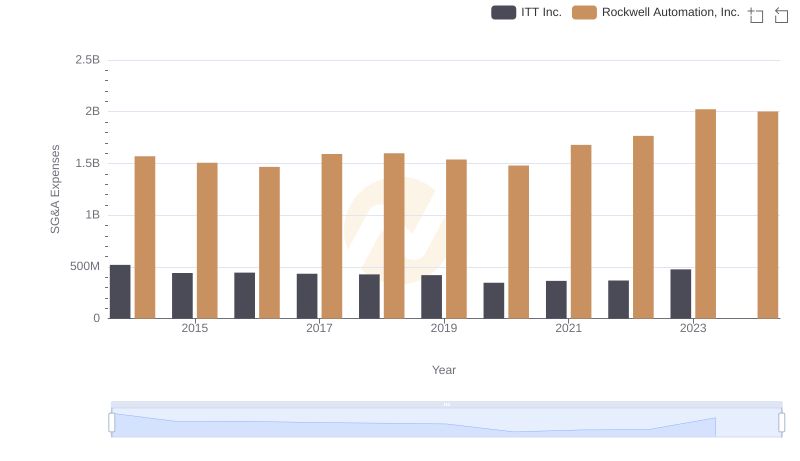
Rockwell Automation, Inc. and ITT Inc.: SG&A Spending Patterns Compared
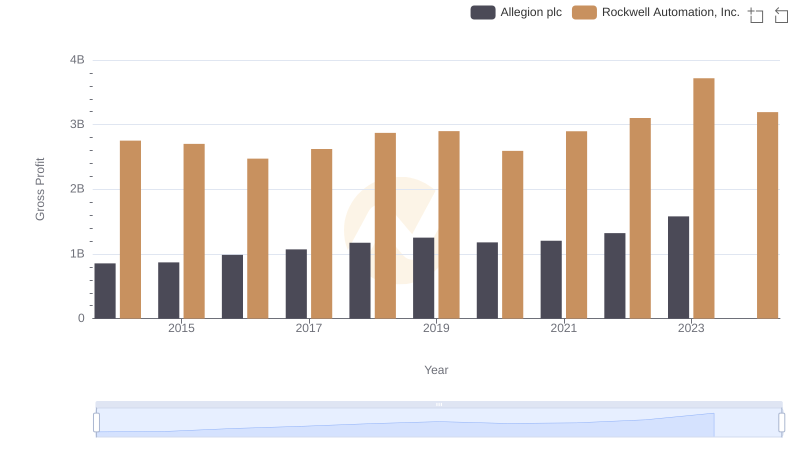
Rockwell Automation, Inc. and Allegion plc: A Detailed Gross Profit Analysis
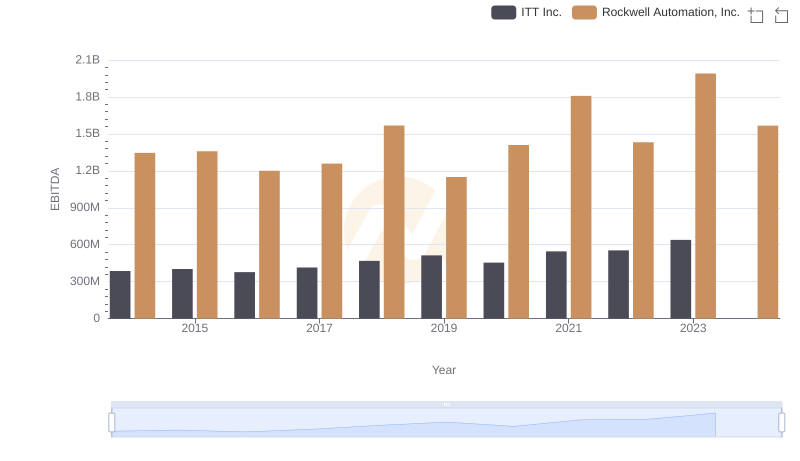
Rockwell Automation, Inc. vs ITT Inc.: In-Depth EBITDA Performance Comparison