| __timestamp | Allegion plc | Rockwell Automation, Inc. |
|---|---|---|
| Wednesday, January 1, 2014 | 1264600000 | 3869600000 |
| Thursday, January 1, 2015 | 1199000000 | 3604800000 |
| Friday, January 1, 2016 | 1252700000 | 3404000000 |
| Sunday, January 1, 2017 | 1337500000 | 3687100000 |
| Monday, January 1, 2018 | 1558400000 | 3793800000 |
| Tuesday, January 1, 2019 | 1601700000 | 3794700000 |
| Wednesday, January 1, 2020 | 1541100000 | 3734600000 |
| Friday, January 1, 2021 | 1662500000 | 4099700000 |
| Saturday, January 1, 2022 | 1949500000 | 4658400000 |
| Sunday, January 1, 2023 | 2069300000 | 5341000000 |
| Monday, January 1, 2024 | 2103700000 | 5070800000 |
Unveiling the hidden dimensions of data
In the competitive landscape of industrial automation and security solutions, Rockwell Automation, Inc. and Allegion plc have carved out significant niches. Over the past decade, Rockwell Automation has consistently outpaced Allegion in terms of cost of revenue, reflecting its larger scale and broader market reach. From 2014 to 2023, Rockwell's cost of revenue surged by approximately 38%, peaking at over $5.3 billion in 2023. In contrast, Allegion's cost of revenue grew by about 64% during the same period, reaching over $2 billion. This growth trajectory highlights Allegion's aggressive expansion and operational scaling. However, the data for 2024 shows a gap for Allegion, indicating potential reporting delays or strategic shifts. As these industry leaders continue to evolve, their financial strategies will be pivotal in shaping their future market positions.
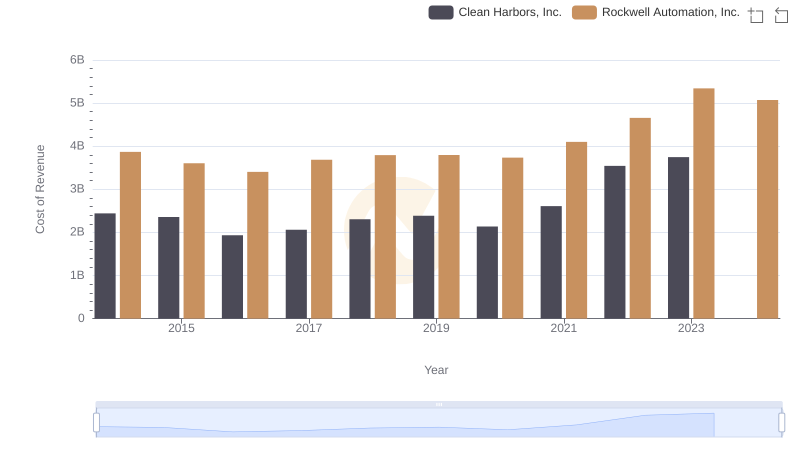
Comparing Cost of Revenue Efficiency: Rockwell Automation, Inc. vs Clean Harbors, Inc.
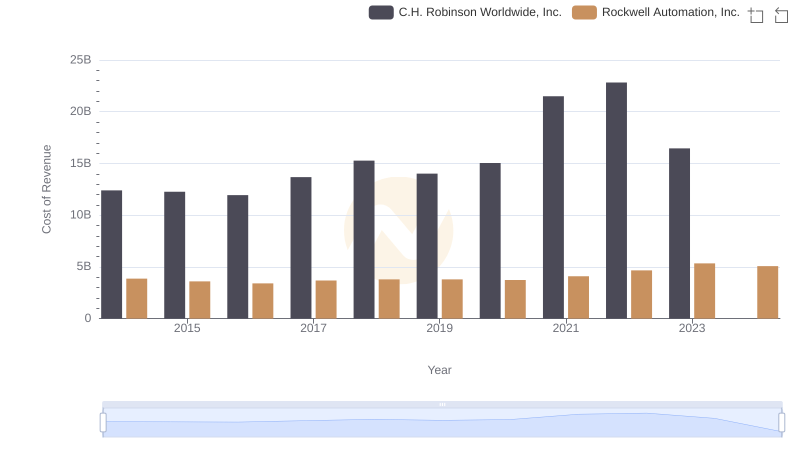
Analyzing Cost of Revenue: Rockwell Automation, Inc. and C.H. Robinson Worldwide, Inc.
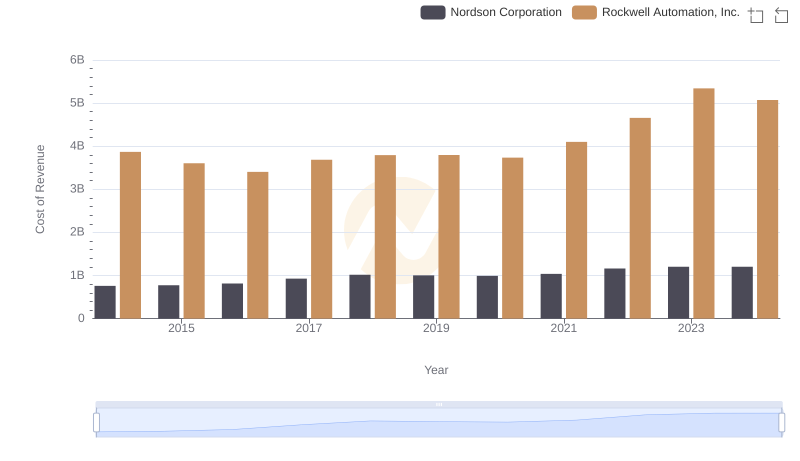
Analyzing Cost of Revenue: Rockwell Automation, Inc. and Nordson Corporation
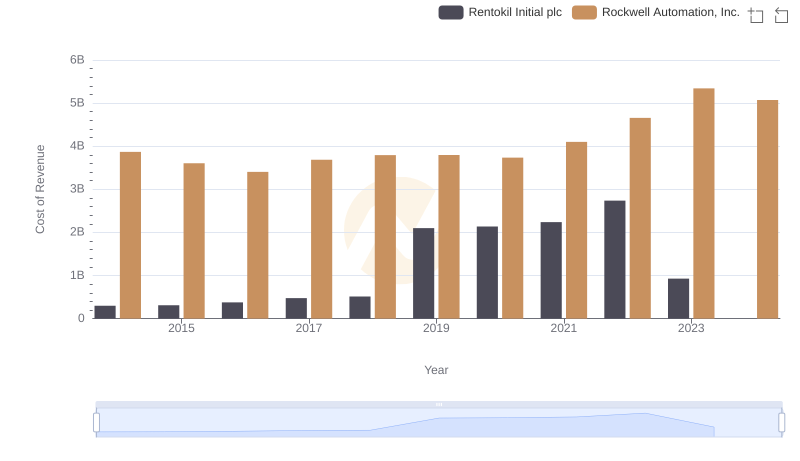
Cost Insights: Breaking Down Rockwell Automation, Inc. and Rentokil Initial plc's Expenses
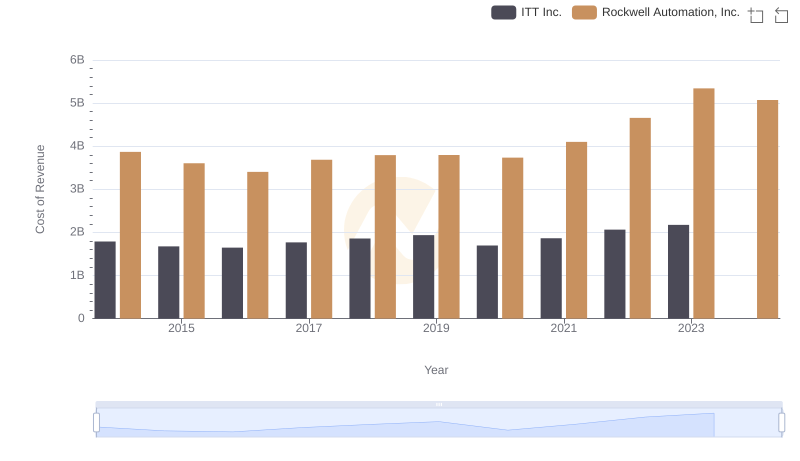
Cost of Revenue Trends: Rockwell Automation, Inc. vs ITT Inc.
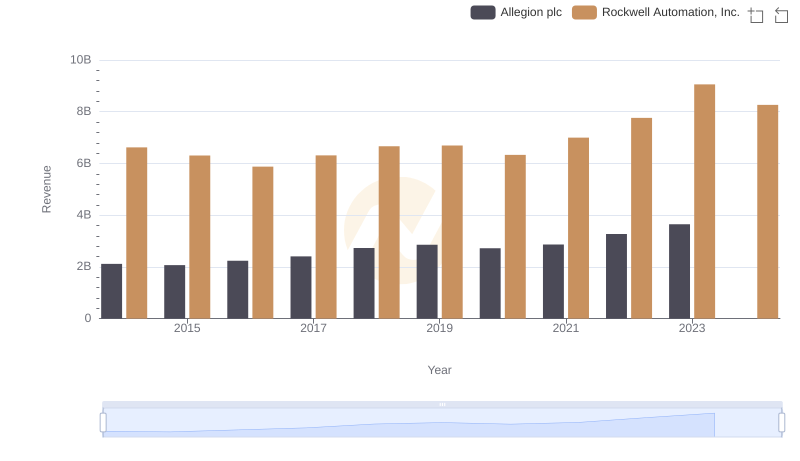
Comparing Revenue Performance: Rockwell Automation, Inc. or Allegion plc?
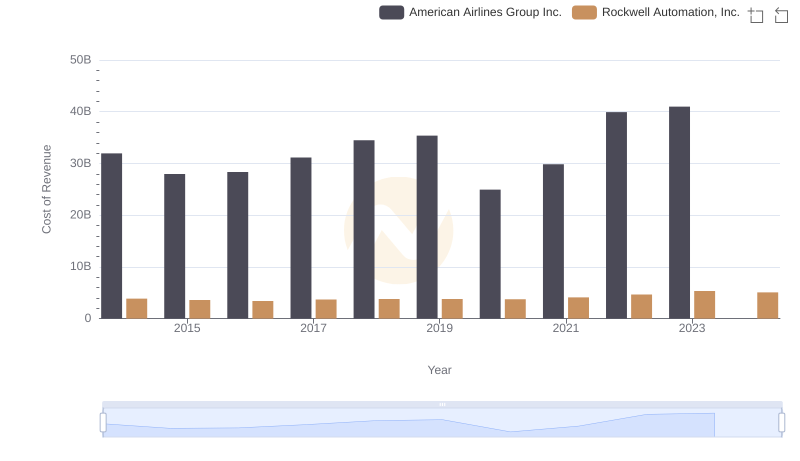
Cost Insights: Breaking Down Rockwell Automation, Inc. and American Airlines Group Inc.'s Expenses
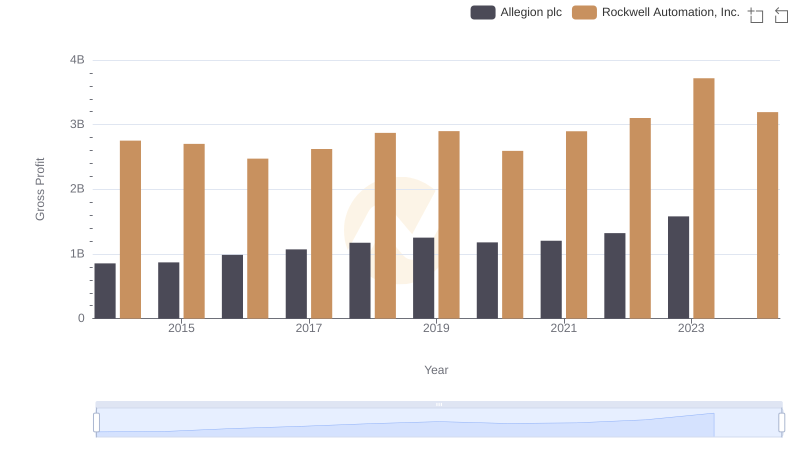
Rockwell Automation, Inc. and Allegion plc: A Detailed Gross Profit Analysis
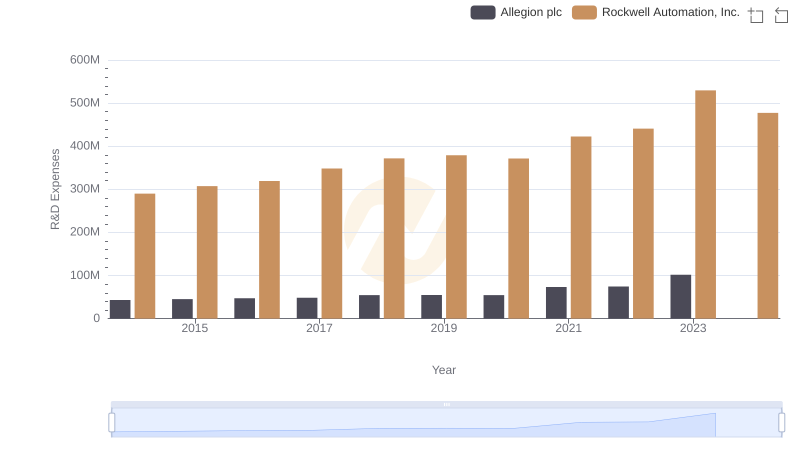
R&D Spending Showdown: Rockwell Automation, Inc. vs Allegion plc
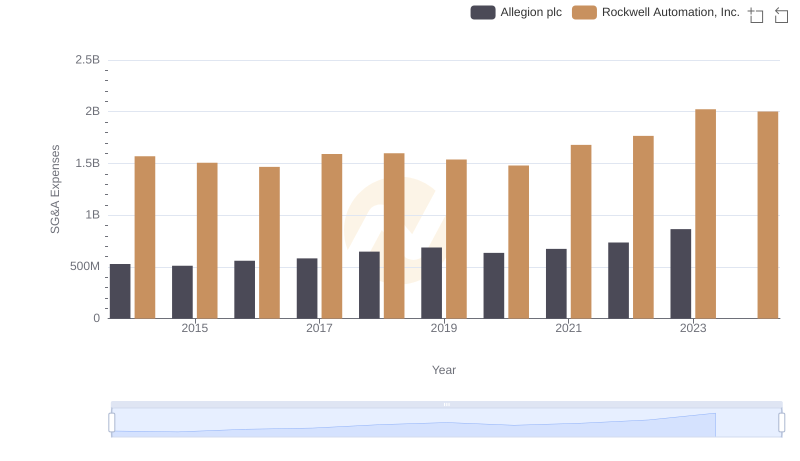
Breaking Down SG&A Expenses: Rockwell Automation, Inc. vs Allegion plc

Rockwell Automation, Inc. vs Allegion plc: In-Depth EBITDA Performance Comparison