| __timestamp | Illinois Tool Works Inc. | Parker-Hannifin Corporation |
|---|---|---|
| Wednesday, January 1, 2014 | 8673000000 | 10188227000 |
| Thursday, January 1, 2015 | 7888000000 | 9655245000 |
| Friday, January 1, 2016 | 7896000000 | 8823384000 |
| Sunday, January 1, 2017 | 8309000000 | 9188962000 |
| Monday, January 1, 2018 | 8604000000 | 10762841000 |
| Tuesday, January 1, 2019 | 8187000000 | 10703484000 |
| Wednesday, January 1, 2020 | 7375000000 | 10286518000 |
| Friday, January 1, 2021 | 8489000000 | 10449680000 |
| Saturday, January 1, 2022 | 9429000000 | 11387267000 |
| Sunday, January 1, 2023 | 9316000000 | 12635892000 |
| Monday, January 1, 2024 | 8858000000 | 12801816000 |
Cracking the code
In the ever-evolving landscape of industrial manufacturing, understanding cost dynamics is crucial. Over the past decade, Parker-Hannifin Corporation and Illinois Tool Works Inc. have showcased distinct trends in their cost of revenue. From 2014 to 2023, Parker-Hannifin's cost of revenue surged by approximately 25%, peaking at $12.6 billion in 2023. In contrast, Illinois Tool Works experienced a more modest increase of around 7%, reaching $9.3 billion in the same year.
The data reveals a consistent upward trajectory for Parker-Hannifin, with notable growth post-2018, while Illinois Tool Works displayed fluctuations, particularly between 2015 and 2020. This divergence highlights Parker-Hannifin's aggressive expansion strategies and operational efficiencies. However, the absence of data for Illinois Tool Works in 2024 suggests potential reporting delays or strategic shifts. As these industrial giants navigate future challenges, their cost management strategies will be pivotal in maintaining competitive edges.
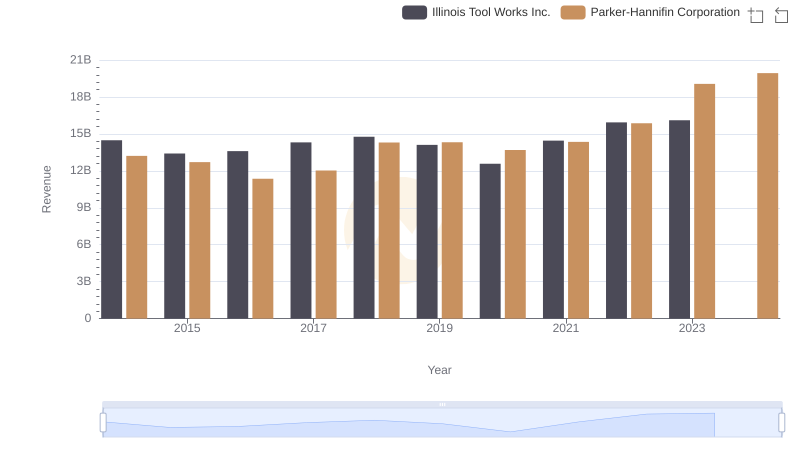
Parker-Hannifin Corporation and Illinois Tool Works Inc.: A Comprehensive Revenue Analysis
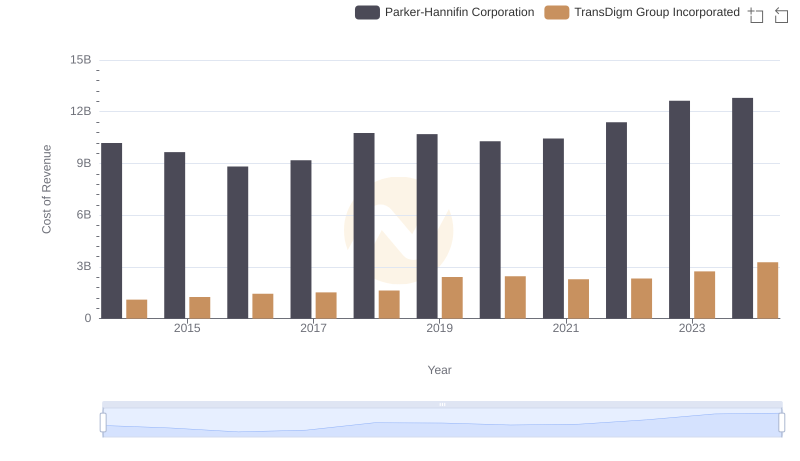
Analyzing Cost of Revenue: Parker-Hannifin Corporation and TransDigm Group Incorporated
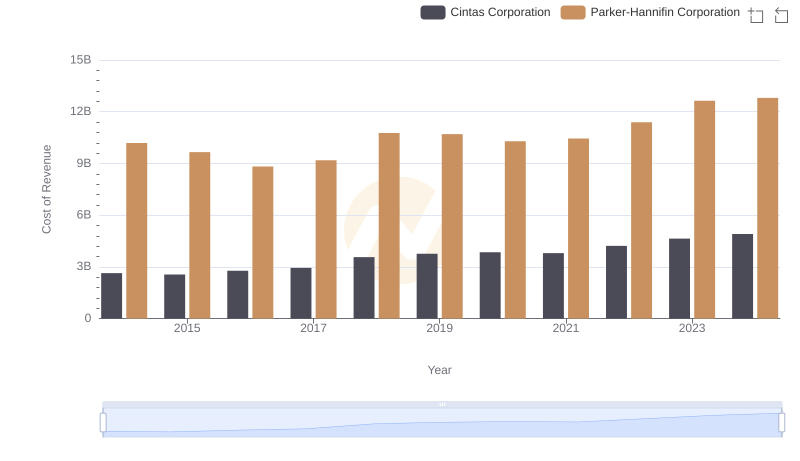
Cost Insights: Breaking Down Parker-Hannifin Corporation and Cintas Corporation's Expenses
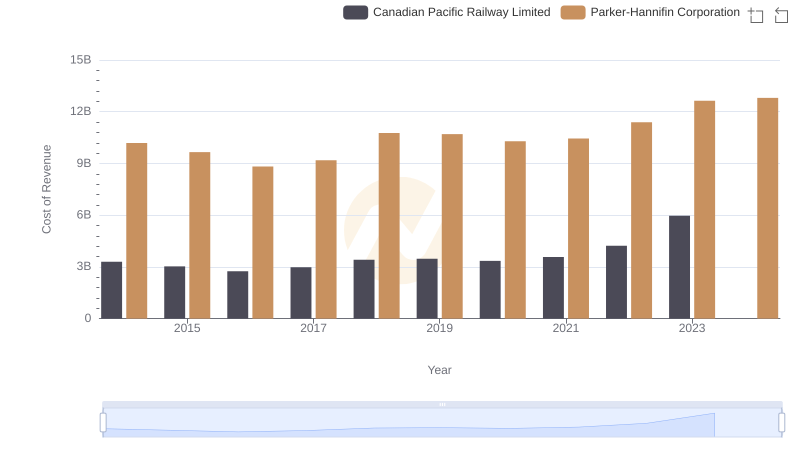
Cost of Revenue Trends: Parker-Hannifin Corporation vs Canadian Pacific Railway Limited
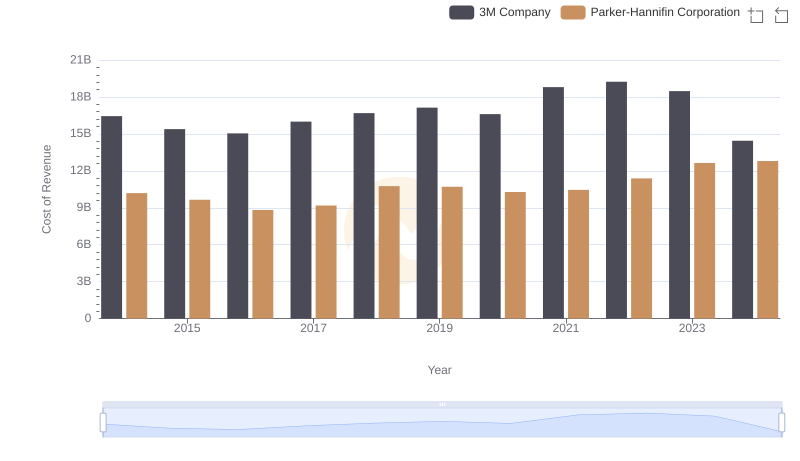
Parker-Hannifin Corporation vs 3M Company: Efficiency in Cost of Revenue Explored
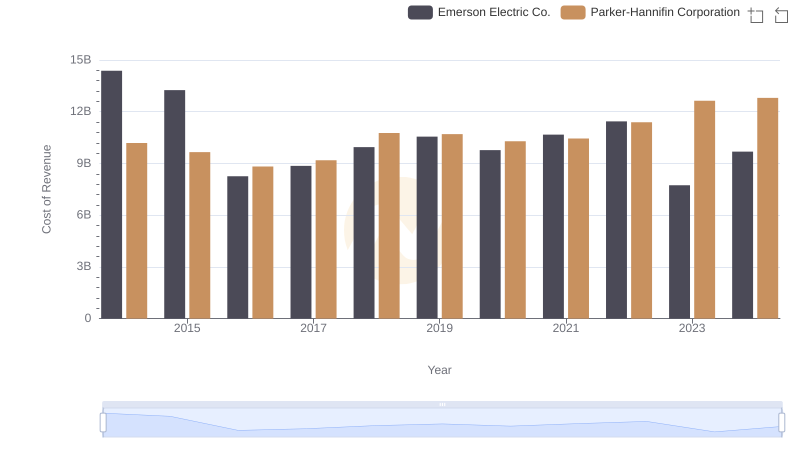
Comparing Cost of Revenue Efficiency: Parker-Hannifin Corporation vs Emerson Electric Co.
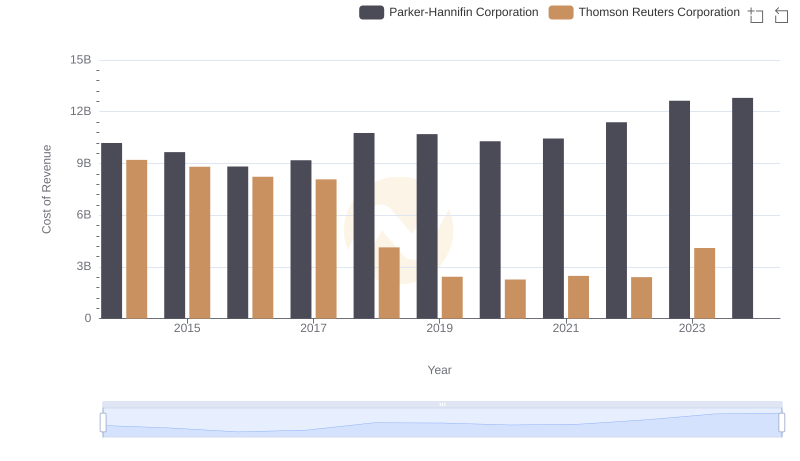
Comparing Cost of Revenue Efficiency: Parker-Hannifin Corporation vs Thomson Reuters Corporation
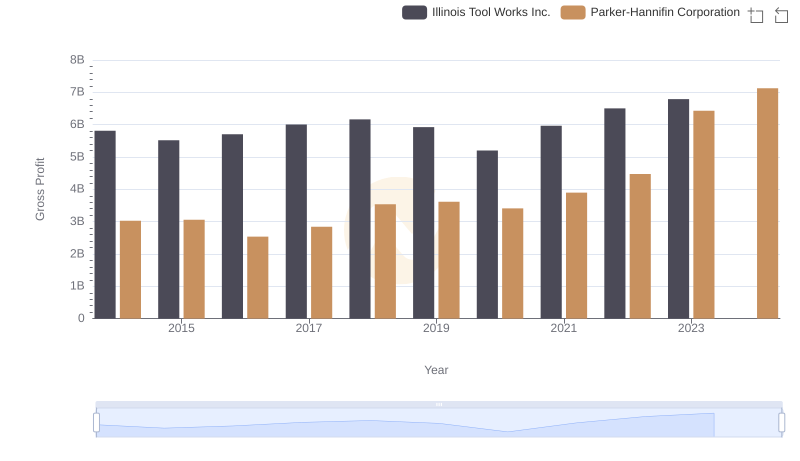
Parker-Hannifin Corporation vs Illinois Tool Works Inc.: A Gross Profit Performance Breakdown
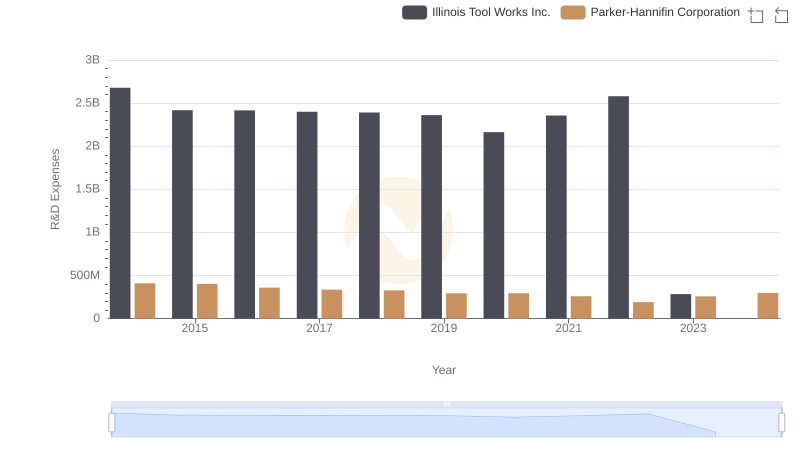
Research and Development Expenses Breakdown: Parker-Hannifin Corporation vs Illinois Tool Works Inc.
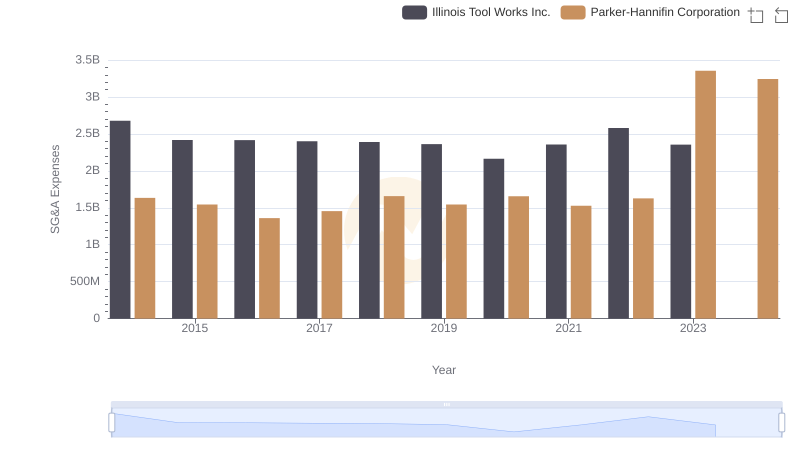
Breaking Down SG&A Expenses: Parker-Hannifin Corporation vs Illinois Tool Works Inc.

EBITDA Metrics Evaluated: Parker-Hannifin Corporation vs Illinois Tool Works Inc.