| __timestamp | 3M Company | Parker-Hannifin Corporation |
|---|---|---|
| Wednesday, January 1, 2014 | 16447000000 | 10188227000 |
| Thursday, January 1, 2015 | 15383000000 | 9655245000 |
| Friday, January 1, 2016 | 15040000000 | 8823384000 |
| Sunday, January 1, 2017 | 16001000000 | 9188962000 |
| Monday, January 1, 2018 | 16682000000 | 10762841000 |
| Tuesday, January 1, 2019 | 17136000000 | 10703484000 |
| Wednesday, January 1, 2020 | 16605000000 | 10286518000 |
| Friday, January 1, 2021 | 18795000000 | 10449680000 |
| Saturday, January 1, 2022 | 19232000000 | 11387267000 |
| Sunday, January 1, 2023 | 18477000000 | 12635892000 |
| Monday, January 1, 2024 | 14447000000 | 12801816000 |
Data in motion
In the competitive landscape of industrial giants, Parker-Hannifin Corporation and 3M Company have long been at the forefront of innovation and efficiency. This analysis delves into their cost of revenue from 2014 to 2024, revealing intriguing trends in their financial strategies.
Over the past decade, 3M's cost of revenue has fluctuated, peaking in 2022 with a 15% increase from 2014, before dropping by 25% in 2024. Meanwhile, Parker-Hannifin has shown a steady upward trajectory, with a notable 26% rise in 2023 compared to 2014, reflecting its strategic cost management.
These trends highlight Parker-Hannifin's consistent efficiency improvements, while 3M's recent decline suggests potential challenges. As these industry leaders navigate economic shifts, their cost strategies will be pivotal in maintaining competitive edges. This data offers a window into their evolving financial landscapes, providing valuable insights for investors and industry analysts alike.
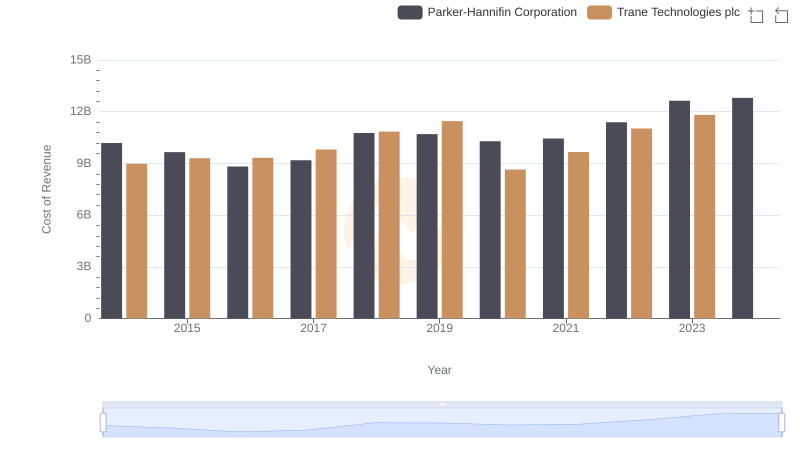
Cost Insights: Breaking Down Parker-Hannifin Corporation and Trane Technologies plc's Expenses
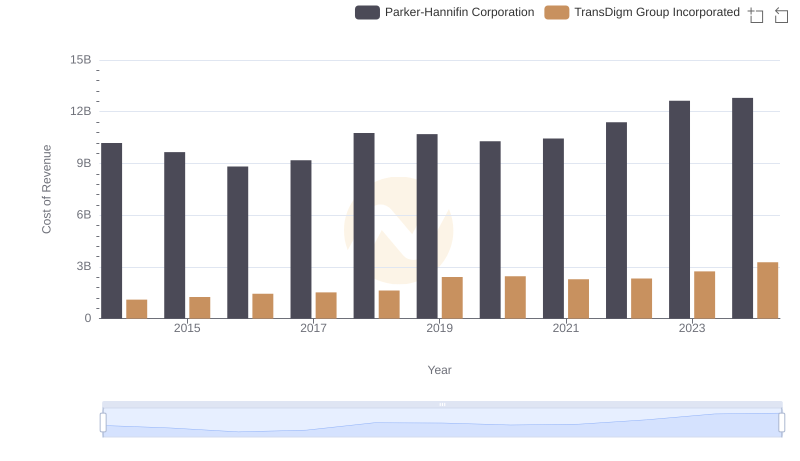
Analyzing Cost of Revenue: Parker-Hannifin Corporation and TransDigm Group Incorporated
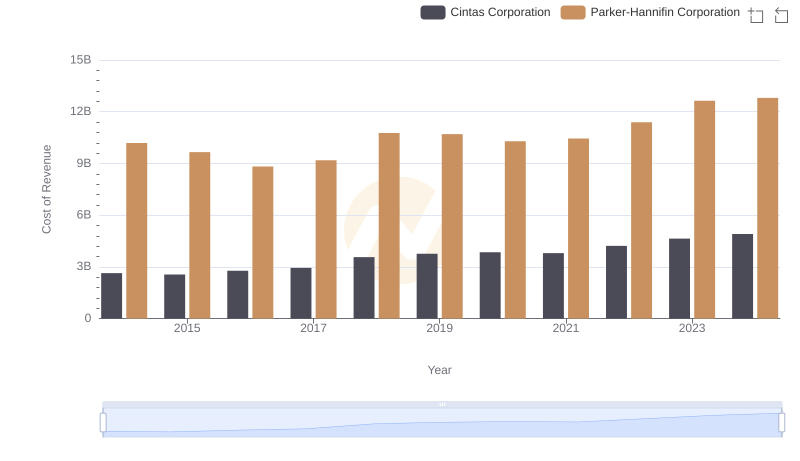
Cost Insights: Breaking Down Parker-Hannifin Corporation and Cintas Corporation's Expenses
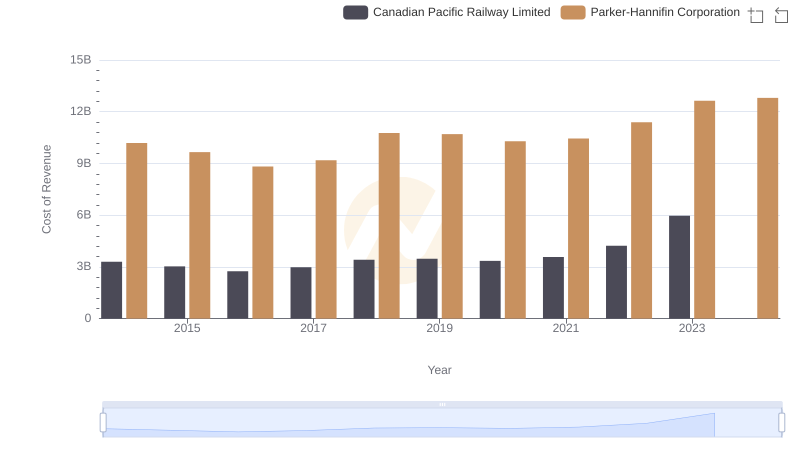
Cost of Revenue Trends: Parker-Hannifin Corporation vs Canadian Pacific Railway Limited

Cost of Revenue Trends: Parker-Hannifin Corporation vs Illinois Tool Works Inc.
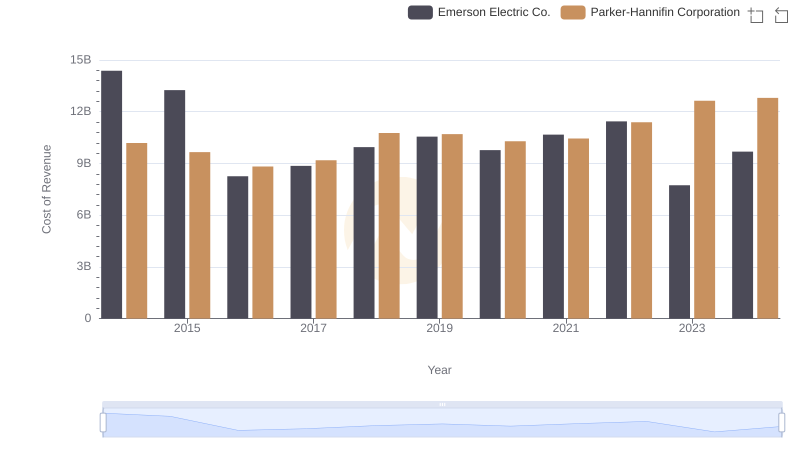
Comparing Cost of Revenue Efficiency: Parker-Hannifin Corporation vs Emerson Electric Co.
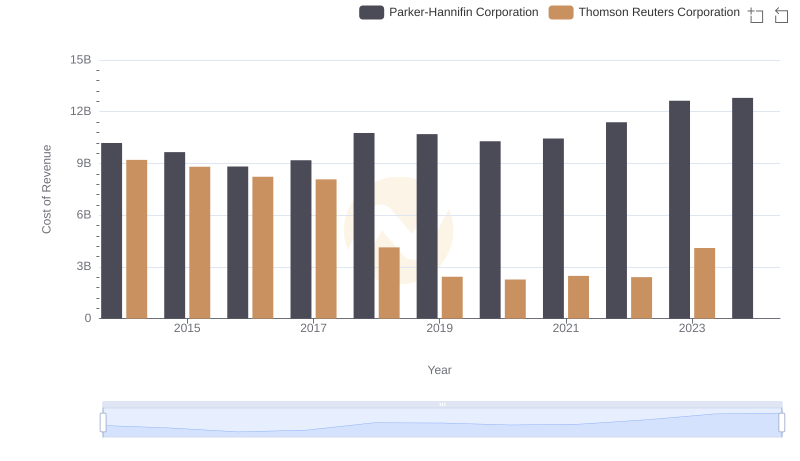
Comparing Cost of Revenue Efficiency: Parker-Hannifin Corporation vs Thomson Reuters Corporation
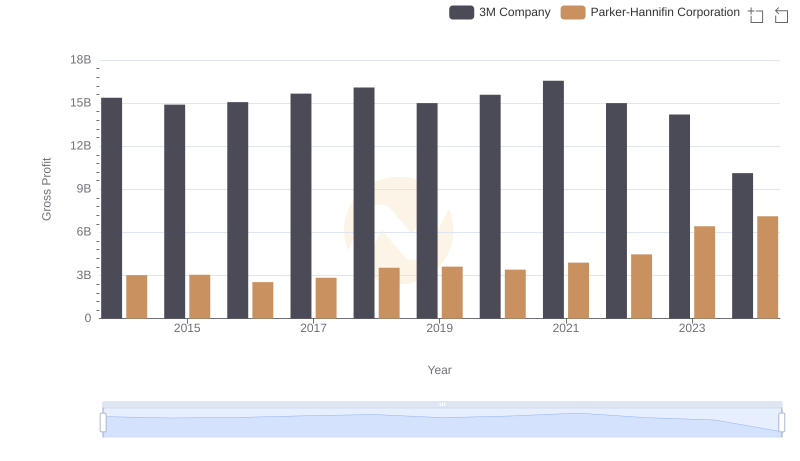
Parker-Hannifin Corporation and 3M Company: A Detailed Gross Profit Analysis
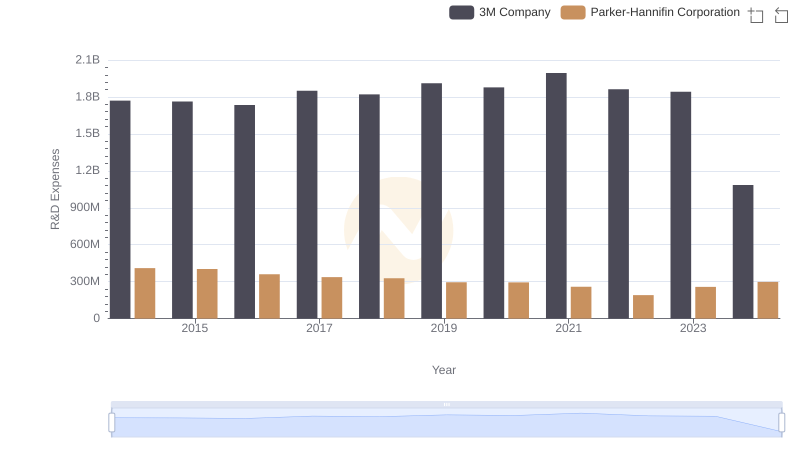
Parker-Hannifin Corporation or 3M Company: Who Invests More in Innovation?
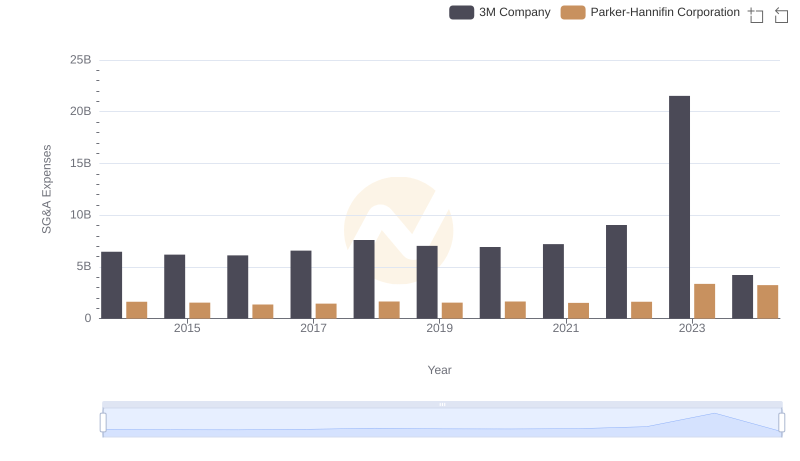
Parker-Hannifin Corporation and 3M Company: SG&A Spending Patterns Compared