| __timestamp | Illinois Tool Works Inc. | Parker-Hannifin Corporation |
|---|---|---|
| Wednesday, January 1, 2014 | 5811000000 | 3027744000 |
| Thursday, January 1, 2015 | 5517000000 | 3056499000 |
| Friday, January 1, 2016 | 5703000000 | 2537369000 |
| Sunday, January 1, 2017 | 6005000000 | 2840350000 |
| Monday, January 1, 2018 | 6164000000 | 3539551000 |
| Tuesday, January 1, 2019 | 5922000000 | 3616840000 |
| Wednesday, January 1, 2020 | 5199000000 | 3409002000 |
| Friday, January 1, 2021 | 5966000000 | 3897960000 |
| Saturday, January 1, 2022 | 6503000000 | 4474341000 |
| Sunday, January 1, 2023 | 6791000000 | 6429302000 |
| Monday, January 1, 2024 | 7040000000 | 7127790000 |
Unlocking the unknown
In the competitive landscape of industrial manufacturing, Parker-Hannifin Corporation and Illinois Tool Works Inc. have long been stalwarts. Over the past decade, these giants have showcased distinct trajectories in gross profit performance. From 2014 to 2023, Illinois Tool Works maintained a steady growth, peaking in 2023 with a 17% increase from its 2014 figures. Meanwhile, Parker-Hannifin demonstrated a remarkable surge, especially post-2020, culminating in a staggering 112% rise by 2023. This growth narrative highlights Parker-Hannifin's strategic pivots and market adaptability. Notably, 2024 data for Illinois Tool Works remains elusive, leaving room for speculation on its future performance. As these companies continue to innovate, their financial journeys offer valuable insights into the evolving industrial sector.
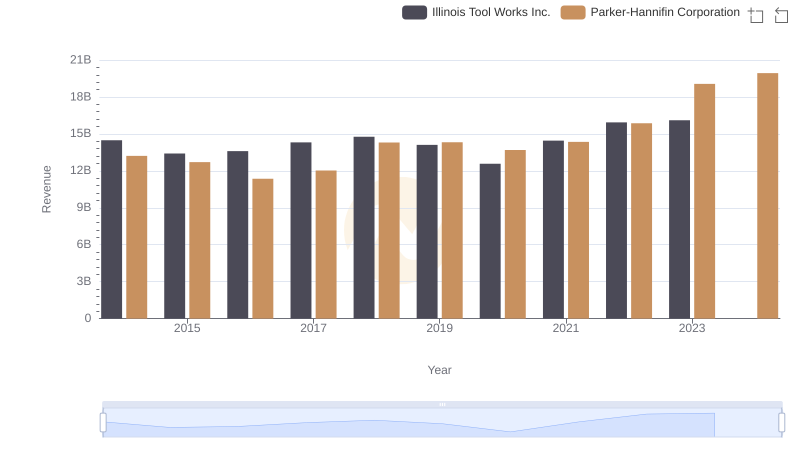
Parker-Hannifin Corporation and Illinois Tool Works Inc.: A Comprehensive Revenue Analysis

Cost of Revenue Trends: Parker-Hannifin Corporation vs Illinois Tool Works Inc.
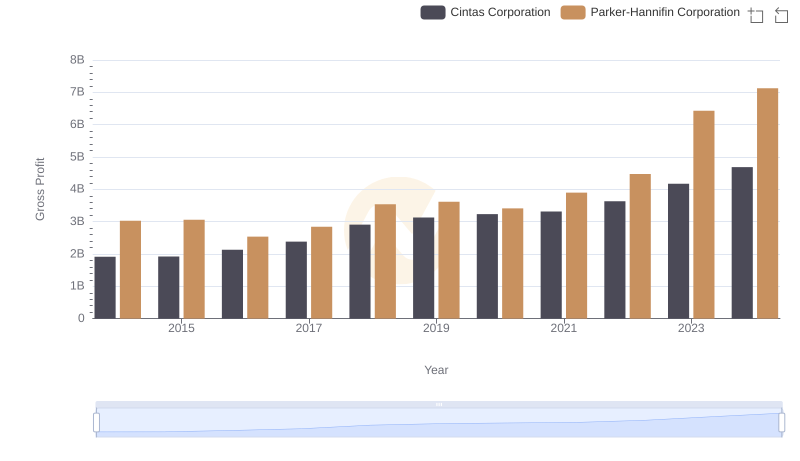
Parker-Hannifin Corporation vs Cintas Corporation: A Gross Profit Performance Breakdown
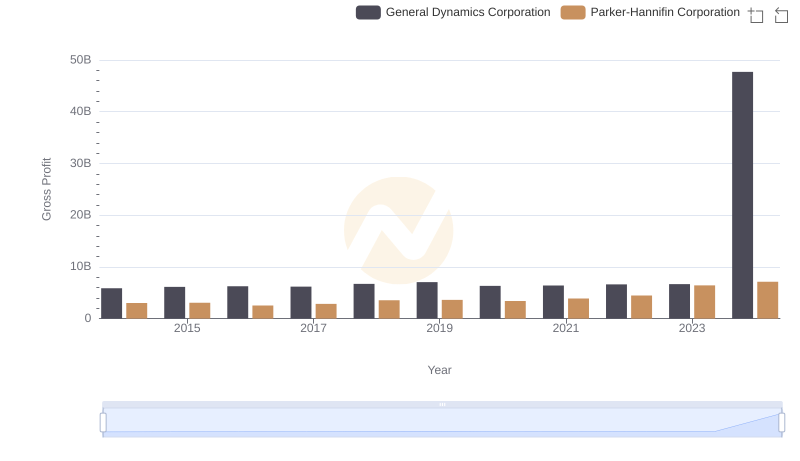
Parker-Hannifin Corporation vs General Dynamics Corporation: A Gross Profit Performance Breakdown
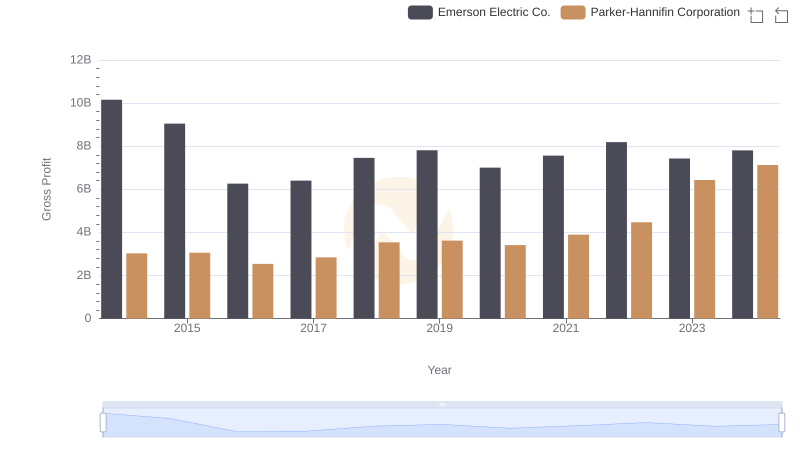
Gross Profit Trends Compared: Parker-Hannifin Corporation vs Emerson Electric Co.
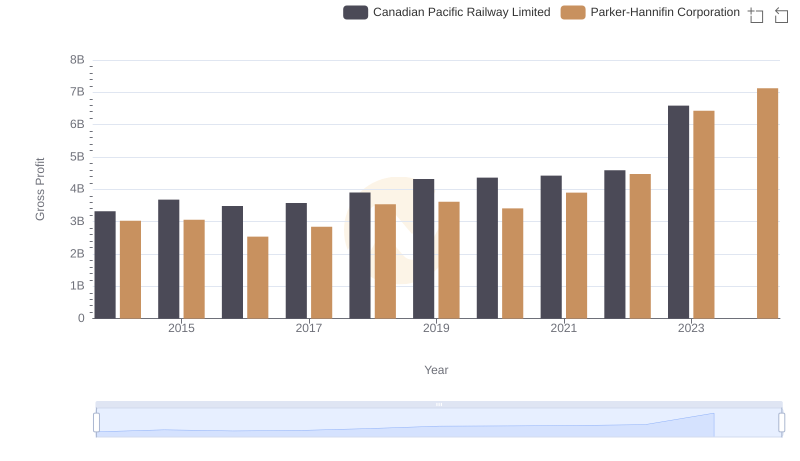
Parker-Hannifin Corporation and Canadian Pacific Railway Limited: A Detailed Gross Profit Analysis
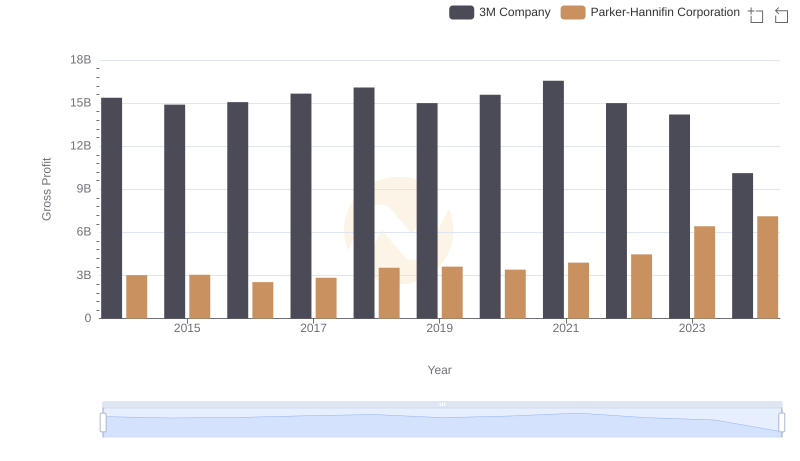
Parker-Hannifin Corporation and 3M Company: A Detailed Gross Profit Analysis
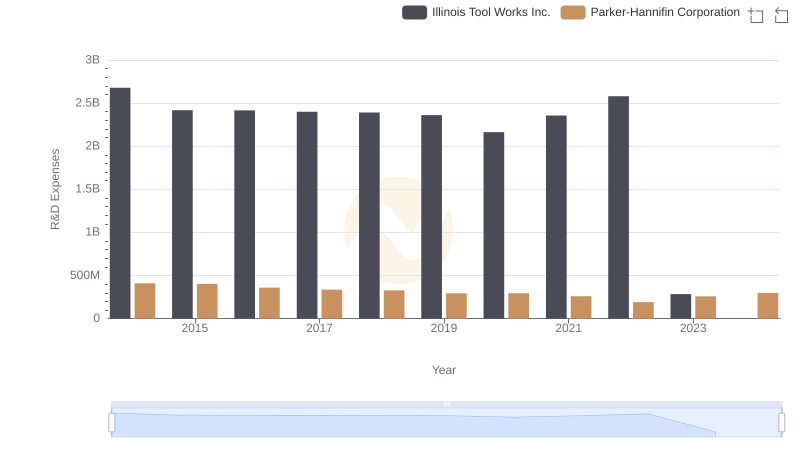
Research and Development Expenses Breakdown: Parker-Hannifin Corporation vs Illinois Tool Works Inc.
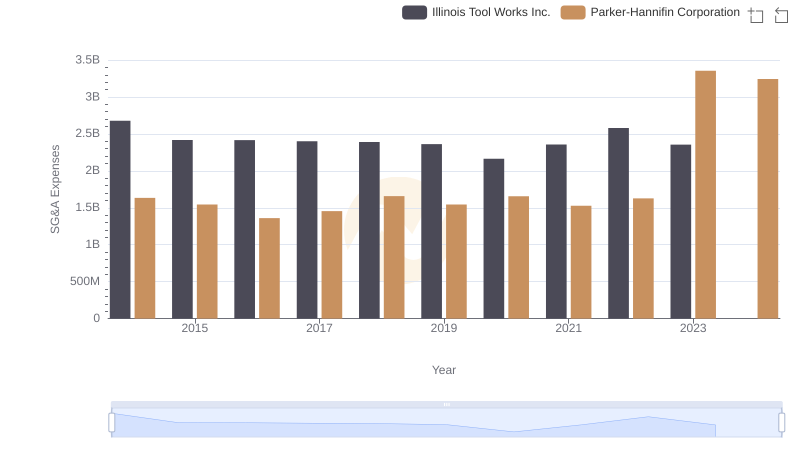
Breaking Down SG&A Expenses: Parker-Hannifin Corporation vs Illinois Tool Works Inc.

EBITDA Metrics Evaluated: Parker-Hannifin Corporation vs Illinois Tool Works Inc.