| __timestamp | Canadian Pacific Railway Limited | Parker-Hannifin Corporation |
|---|---|---|
| Wednesday, January 1, 2014 | 3300000000 | 10188227000 |
| Thursday, January 1, 2015 | 3032000000 | 9655245000 |
| Friday, January 1, 2016 | 2749000000 | 8823384000 |
| Sunday, January 1, 2017 | 2979000000 | 9188962000 |
| Monday, January 1, 2018 | 3413000000 | 10762841000 |
| Tuesday, January 1, 2019 | 3475000000 | 10703484000 |
| Wednesday, January 1, 2020 | 3349000000 | 10286518000 |
| Friday, January 1, 2021 | 3571000000 | 10449680000 |
| Saturday, January 1, 2022 | 4223000000 | 11387267000 |
| Sunday, January 1, 2023 | 5968000000 | 12635892000 |
| Monday, January 1, 2024 | 7003000000 | 12801816000 |
Cracking the code
In the ever-evolving landscape of industrial and transportation sectors, Parker-Hannifin Corporation and Canadian Pacific Railway Limited stand as titans. Over the past decade, Parker-Hannifin has consistently demonstrated robust growth, with its cost of revenue peaking at approximately $12.8 billion in 2024, marking a 25% increase since 2014. Meanwhile, Canadian Pacific Railway has shown a more modest yet steady rise, culminating in a 2023 peak that is nearly double its 2014 figures. This divergence highlights the distinct operational dynamics and market strategies of these industry leaders. Notably, the data for 2024 is incomplete for Canadian Pacific Railway, suggesting potential shifts or challenges ahead. As these companies navigate the complexities of global markets, their financial trajectories offer valuable insights into the broader economic trends shaping their respective industries.
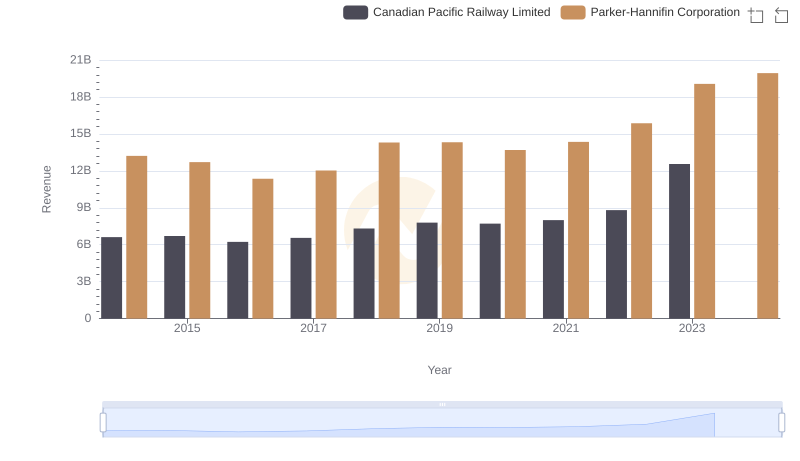
Comparing Revenue Performance: Parker-Hannifin Corporation or Canadian Pacific Railway Limited?
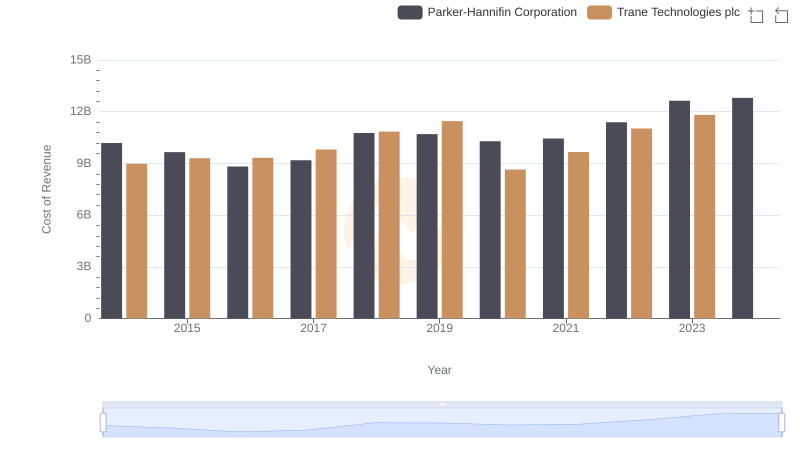
Cost Insights: Breaking Down Parker-Hannifin Corporation and Trane Technologies plc's Expenses
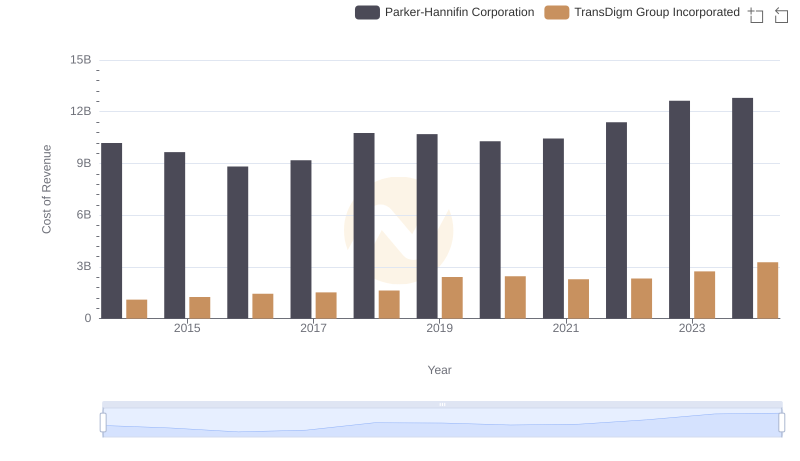
Analyzing Cost of Revenue: Parker-Hannifin Corporation and TransDigm Group Incorporated
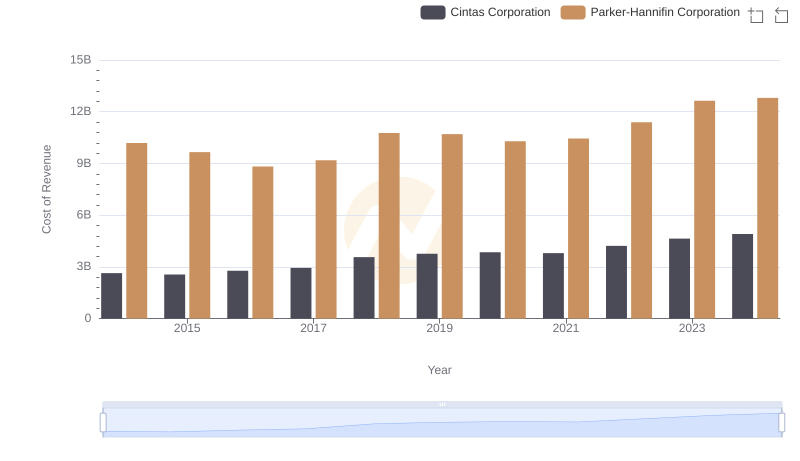
Cost Insights: Breaking Down Parker-Hannifin Corporation and Cintas Corporation's Expenses
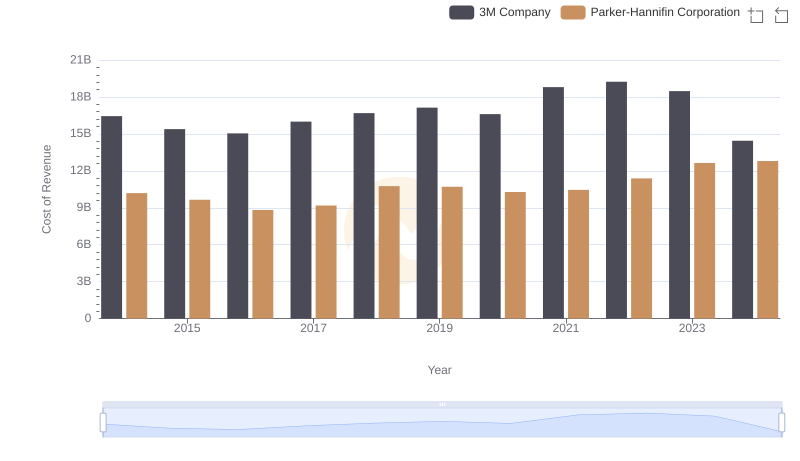
Parker-Hannifin Corporation vs 3M Company: Efficiency in Cost of Revenue Explored

Cost of Revenue Trends: Parker-Hannifin Corporation vs Illinois Tool Works Inc.
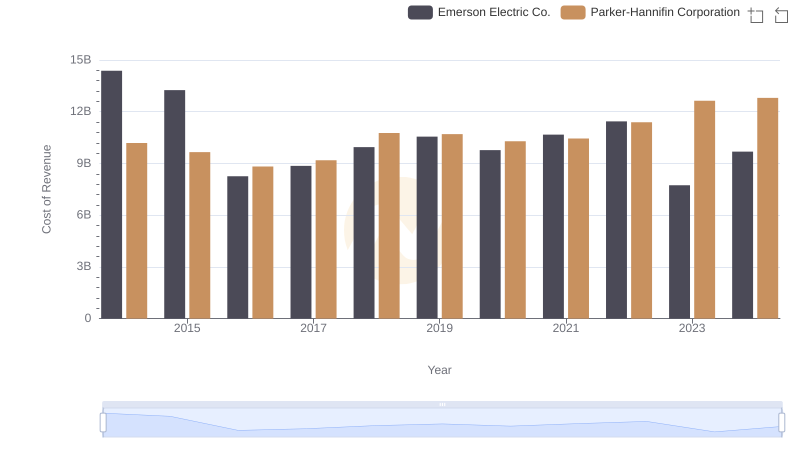
Comparing Cost of Revenue Efficiency: Parker-Hannifin Corporation vs Emerson Electric Co.
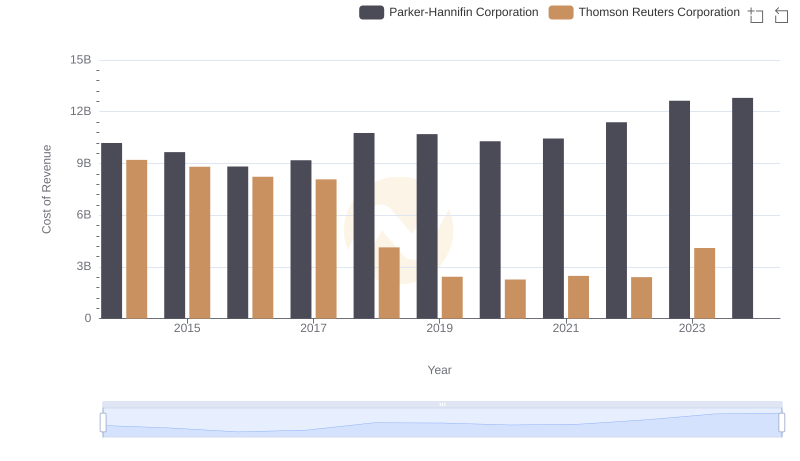
Comparing Cost of Revenue Efficiency: Parker-Hannifin Corporation vs Thomson Reuters Corporation
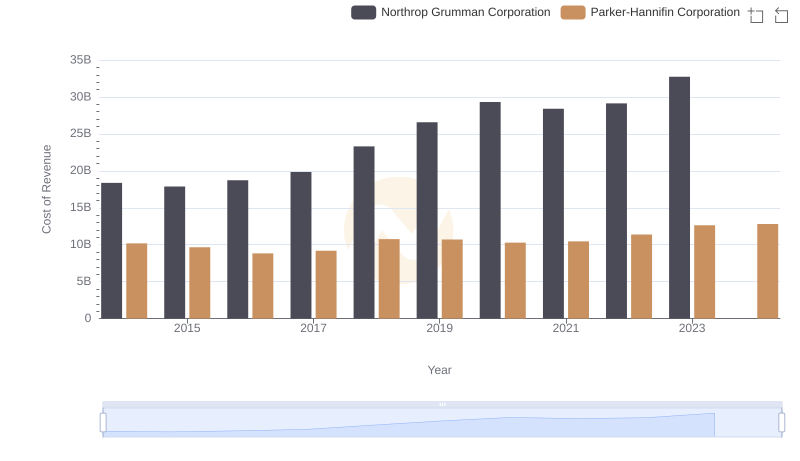
Cost Insights: Breaking Down Parker-Hannifin Corporation and Northrop Grumman Corporation's Expenses
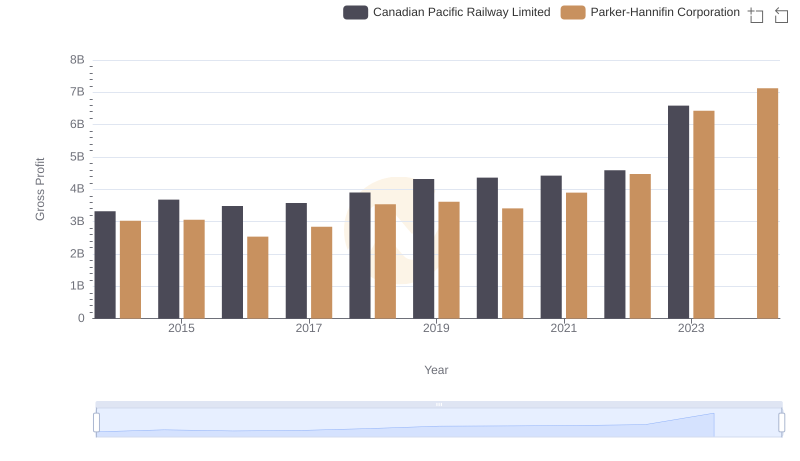
Parker-Hannifin Corporation and Canadian Pacific Railway Limited: A Detailed Gross Profit Analysis