| __timestamp | Illinois Tool Works Inc. | Parker-Hannifin Corporation |
|---|---|---|
| Wednesday, January 1, 2014 | 14484000000 | 13215971000 |
| Thursday, January 1, 2015 | 13405000000 | 12711744000 |
| Friday, January 1, 2016 | 13599000000 | 11360753000 |
| Sunday, January 1, 2017 | 14314000000 | 12029312000 |
| Monday, January 1, 2018 | 14768000000 | 14302392000 |
| Tuesday, January 1, 2019 | 14109000000 | 14320324000 |
| Wednesday, January 1, 2020 | 12574000000 | 13695520000 |
| Friday, January 1, 2021 | 14455000000 | 14347640000 |
| Saturday, January 1, 2022 | 15932000000 | 15861608000 |
| Sunday, January 1, 2023 | 16107000000 | 19065194000 |
| Monday, January 1, 2024 | 15898000000 | 19929606000 |
Unveiling the hidden dimensions of data
In the ever-evolving landscape of industrial manufacturing, Parker-Hannifin Corporation and Illinois Tool Works Inc. stand as giants. Over the past decade, these companies have showcased remarkable resilience and growth. From 2014 to 2023, Parker-Hannifin's revenue surged by approximately 44%, peaking in 2023 with a staggering $19 billion. Meanwhile, Illinois Tool Works experienced a steady climb, with a 12% increase, reaching $16 billion in the same year.
Parker-Hannifin's revenue trajectory highlights a robust recovery post-2020, with a notable 39% increase from 2020 to 2023. Illinois Tool Works, while more stable, saw its most significant growth between 2021 and 2023, with a 11% rise. The data for 2024 is incomplete, but Parker-Hannifin's upward trend suggests continued momentum. These insights underscore the dynamic nature of the industrial sector and the strategic prowess of these industry leaders.
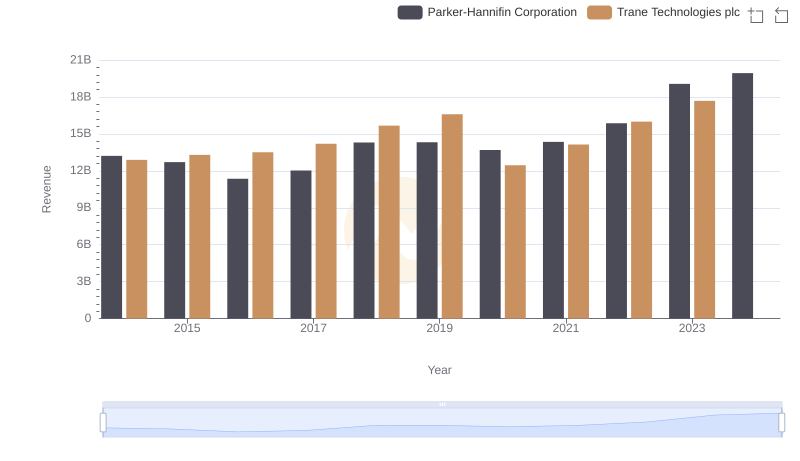
Breaking Down Revenue Trends: Parker-Hannifin Corporation vs Trane Technologies plc
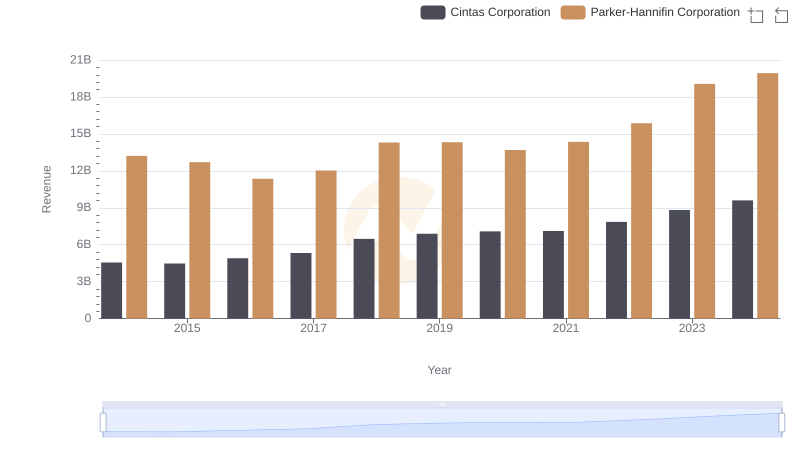
Revenue Showdown: Parker-Hannifin Corporation vs Cintas Corporation

Who Generates More Revenue? Parker-Hannifin Corporation or TransDigm Group Incorporated
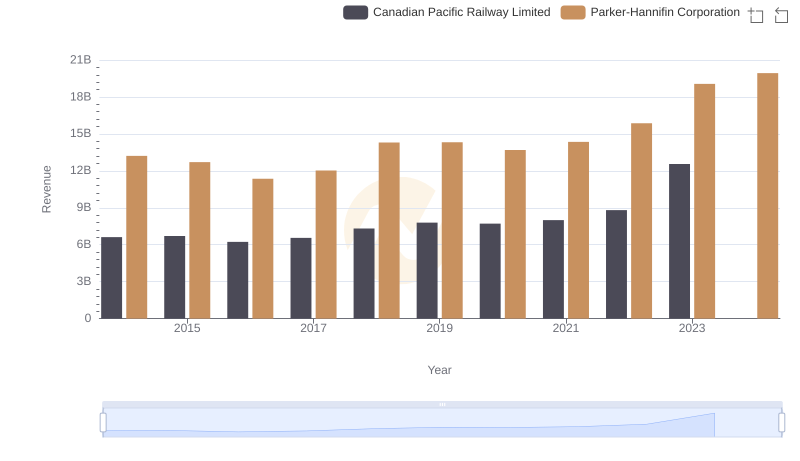
Comparing Revenue Performance: Parker-Hannifin Corporation or Canadian Pacific Railway Limited?
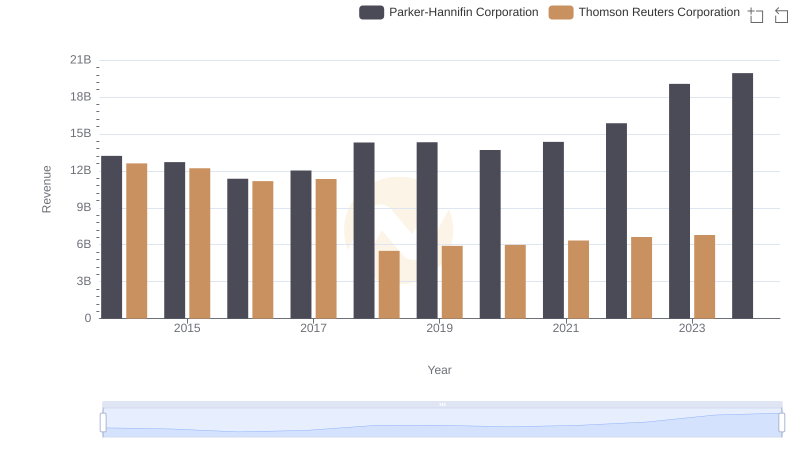
Breaking Down Revenue Trends: Parker-Hannifin Corporation vs Thomson Reuters Corporation

Cost of Revenue Trends: Parker-Hannifin Corporation vs Illinois Tool Works Inc.
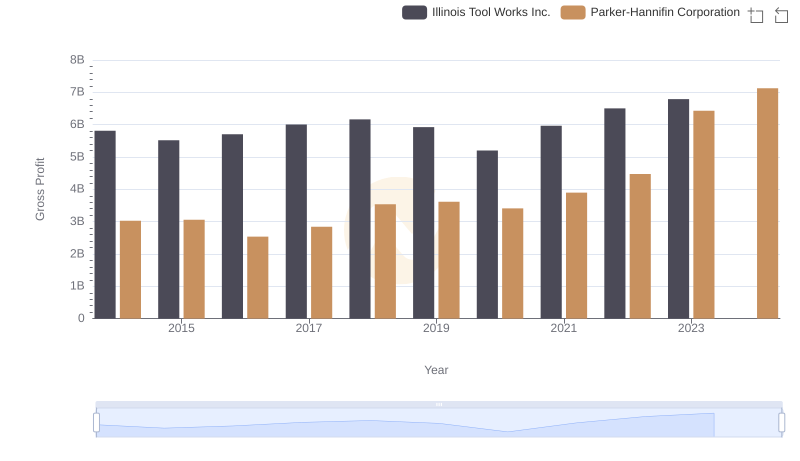
Parker-Hannifin Corporation vs Illinois Tool Works Inc.: A Gross Profit Performance Breakdown
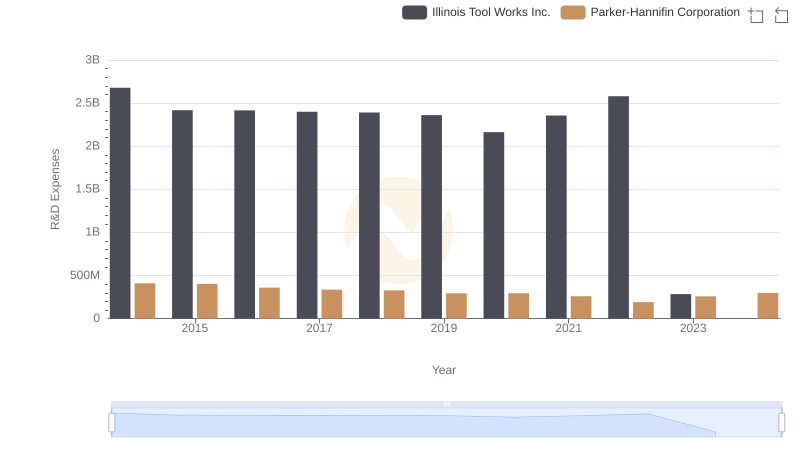
Research and Development Expenses Breakdown: Parker-Hannifin Corporation vs Illinois Tool Works Inc.
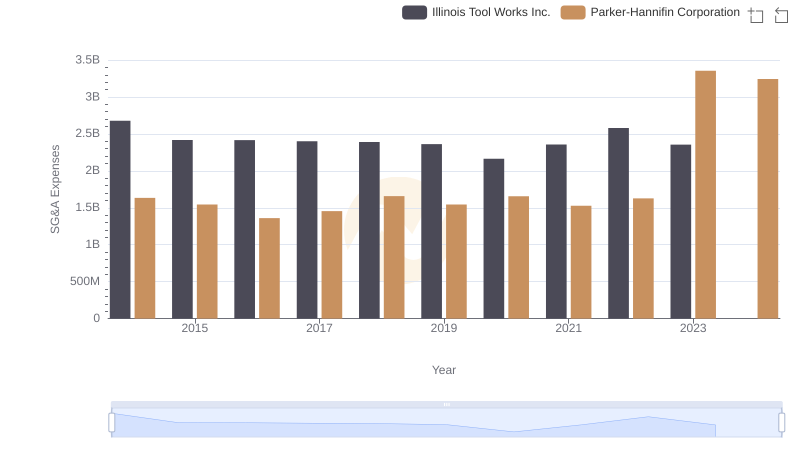
Breaking Down SG&A Expenses: Parker-Hannifin Corporation vs Illinois Tool Works Inc.

EBITDA Metrics Evaluated: Parker-Hannifin Corporation vs Illinois Tool Works Inc.