| __timestamp | Illinois Tool Works Inc. | Parker-Hannifin Corporation |
|---|---|---|
| Wednesday, January 1, 2014 | 2678000000 | 410132000 |
| Thursday, January 1, 2015 | 2417000000 | 403085000 |
| Friday, January 1, 2016 | 2415000000 | 359796000 |
| Sunday, January 1, 2017 | 2400000000 | 336675000 |
| Monday, January 1, 2018 | 2391000000 | 327877000 |
| Tuesday, January 1, 2019 | 2361000000 | 294852000 |
| Wednesday, January 1, 2020 | 2163000000 | 293837000 |
| Friday, January 1, 2021 | 2356000000 | 259039000 |
| Saturday, January 1, 2022 | 2579000000 | 191000000 |
| Sunday, January 1, 2023 | 284000000 | 258000000 |
| Monday, January 1, 2024 | 2675000000 | 298000000 |
Unleashing the power of data
In the competitive landscape of industrial manufacturing, research and development (R&D) spending is a critical indicator of a company's commitment to innovation. Over the past decade, Parker-Hannifin Corporation and Illinois Tool Works Inc. have demonstrated contrasting approaches to R&D investment.
Parker-Hannifin has consistently invested in R&D, with expenses peaking in 2014. Despite a gradual decline, their spending remained robust, averaging around $312 million annually. This commitment underscores their focus on advancing technology and maintaining a competitive edge.
Conversely, Illinois Tool Works Inc. experienced a significant drop in R&D expenses, from a high in 2014 to a notable low in 2023. This 89% decrease reflects a strategic shift, possibly towards operational efficiencies or alternative growth strategies.
These trends highlight the diverse strategies companies employ to navigate the ever-evolving industrial sector.
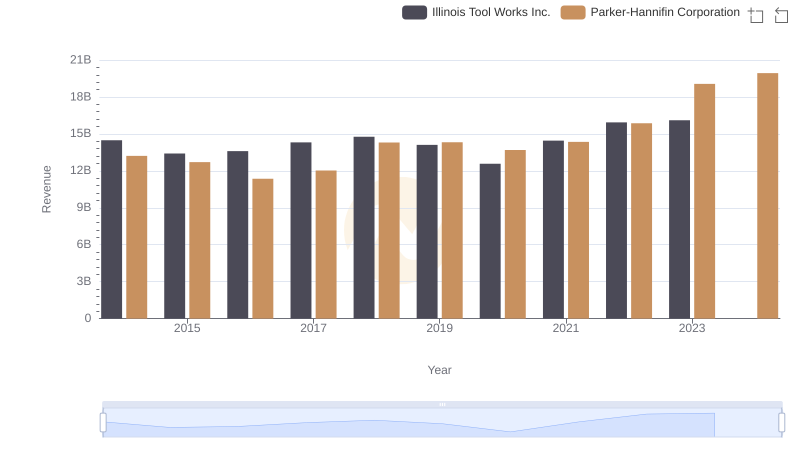
Parker-Hannifin Corporation and Illinois Tool Works Inc.: A Comprehensive Revenue Analysis

Cost of Revenue Trends: Parker-Hannifin Corporation vs Illinois Tool Works Inc.
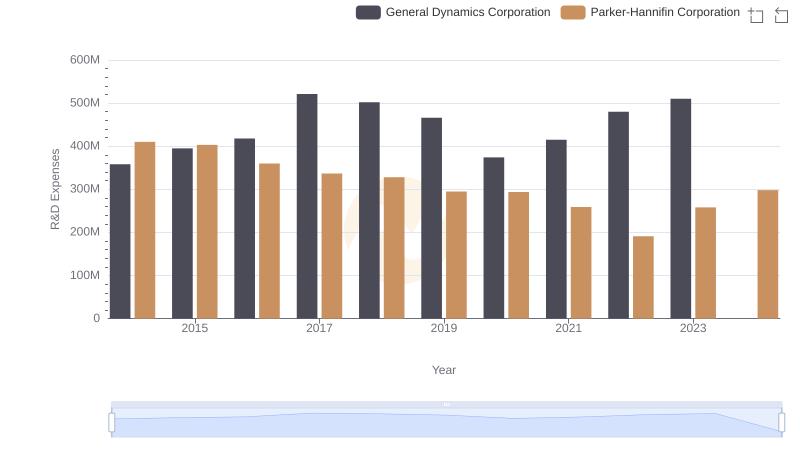
Comparing Innovation Spending: Parker-Hannifin Corporation and General Dynamics Corporation
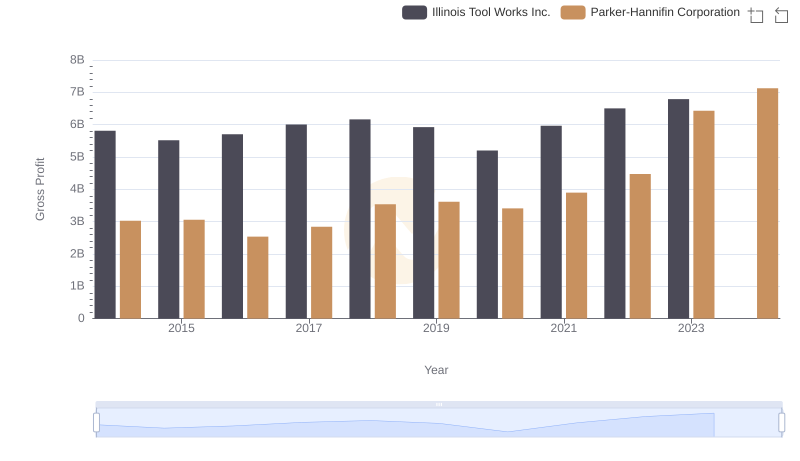
Parker-Hannifin Corporation vs Illinois Tool Works Inc.: A Gross Profit Performance Breakdown
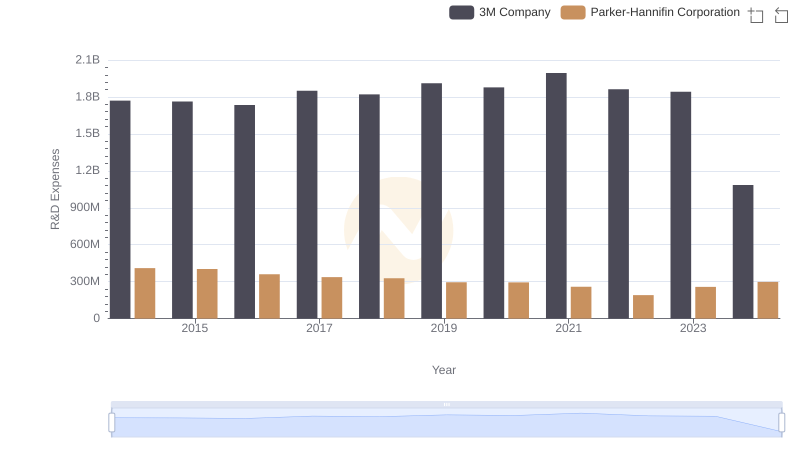
Parker-Hannifin Corporation or 3M Company: Who Invests More in Innovation?
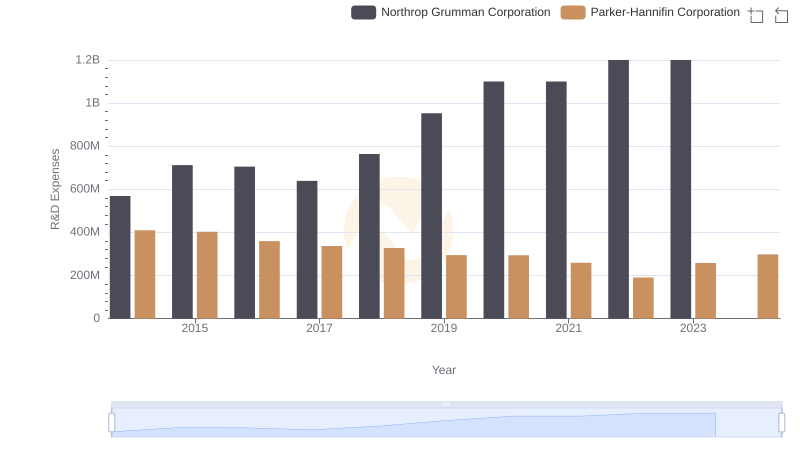
R&D Insights: How Parker-Hannifin Corporation and Northrop Grumman Corporation Allocate Funds
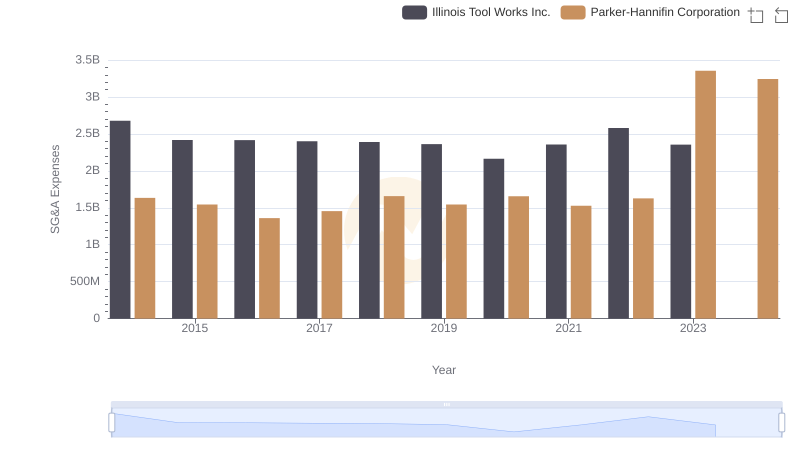
Breaking Down SG&A Expenses: Parker-Hannifin Corporation vs Illinois Tool Works Inc.

EBITDA Metrics Evaluated: Parker-Hannifin Corporation vs Illinois Tool Works Inc.
R&D Spending Showdown: Parker-Hannifin Corporation vs Roper Technologies, Inc.
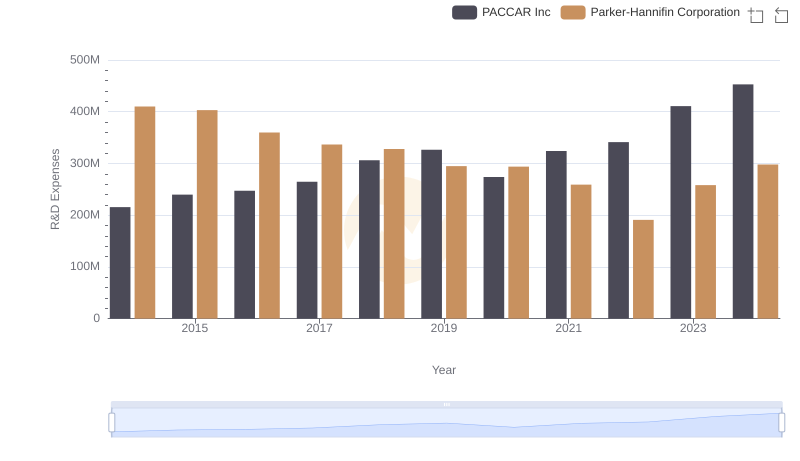
Parker-Hannifin Corporation vs PACCAR Inc: Strategic Focus on R&D Spending
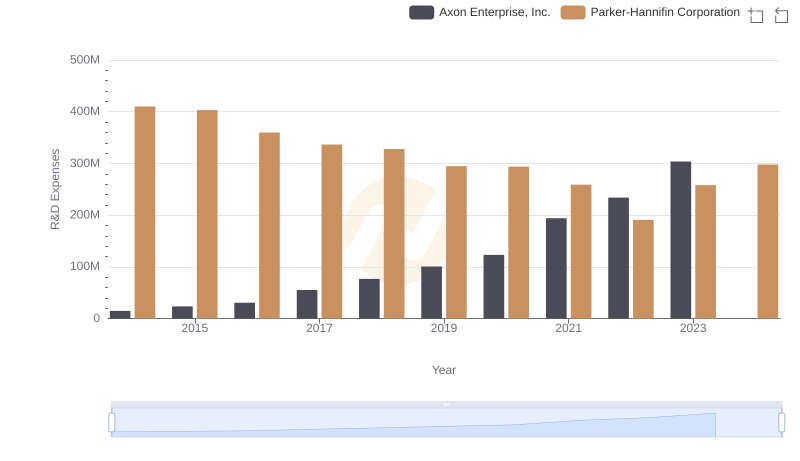
R&D Spending Showdown: Parker-Hannifin Corporation vs Axon Enterprise, Inc.