| __timestamp | Cintas Corporation | Parker-Hannifin Corporation |
|---|---|---|
| Wednesday, January 1, 2014 | 2637426000 | 10188227000 |
| Thursday, January 1, 2015 | 2555549000 | 9655245000 |
| Friday, January 1, 2016 | 2775588000 | 8823384000 |
| Sunday, January 1, 2017 | 2943086000 | 9188962000 |
| Monday, January 1, 2018 | 3568109000 | 10762841000 |
| Tuesday, January 1, 2019 | 3763715000 | 10703484000 |
| Wednesday, January 1, 2020 | 3851372000 | 10286518000 |
| Friday, January 1, 2021 | 3801689000 | 10449680000 |
| Saturday, January 1, 2022 | 4222213000 | 11387267000 |
| Sunday, January 1, 2023 | 4642401000 | 12635892000 |
| Monday, January 1, 2024 | 4910199000 | 12801816000 |
Unleashing the power of data
In the ever-evolving landscape of industrial and service sectors, understanding cost structures is pivotal. Parker-Hannifin Corporation, a leader in motion and control technologies, and Cintas Corporation, a prominent player in corporate identity uniform programs, offer intriguing insights into cost management from 2014 to 2024. Over this decade, Parker-Hannifin's cost of revenue has consistently outpaced Cintas, reflecting its expansive operations. Notably, Parker-Hannifin's costs peaked in 2024, marking a 25% increase from 2014. Meanwhile, Cintas demonstrated a steady growth trajectory, with a 86% rise in costs over the same period. This trend underscores the differing scales and operational strategies of these corporations. As businesses navigate economic fluctuations, these insights into cost dynamics provide valuable lessons in strategic financial planning.
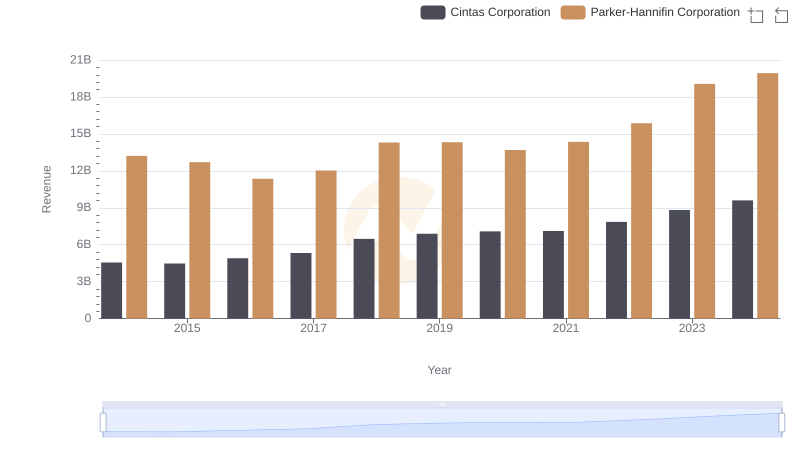
Revenue Showdown: Parker-Hannifin Corporation vs Cintas Corporation
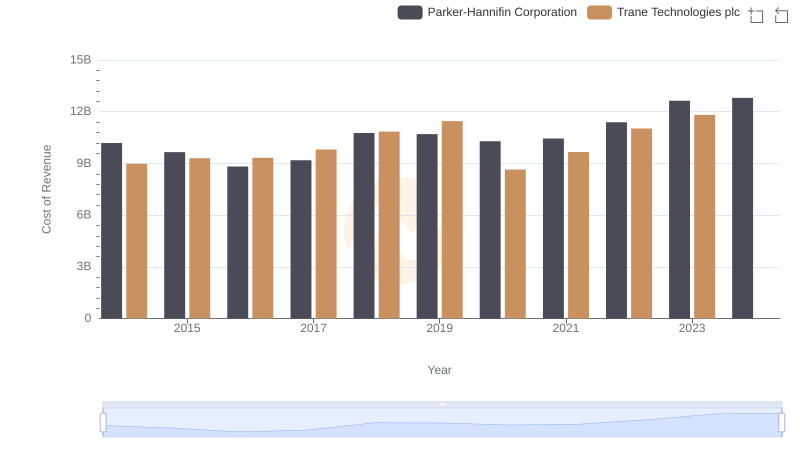
Cost Insights: Breaking Down Parker-Hannifin Corporation and Trane Technologies plc's Expenses
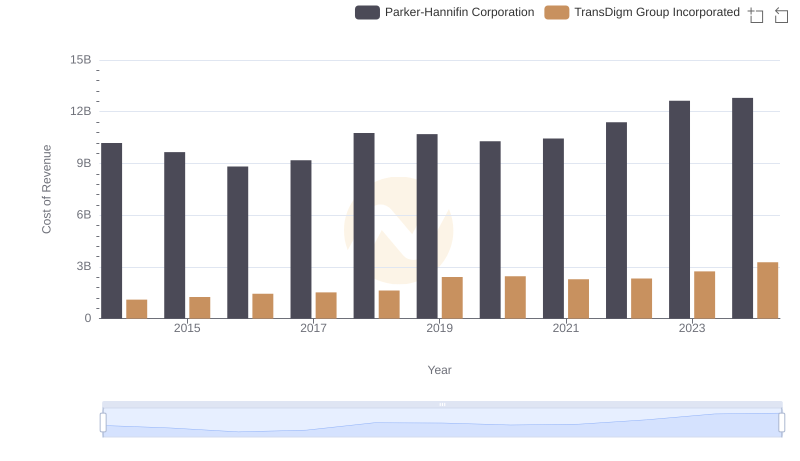
Analyzing Cost of Revenue: Parker-Hannifin Corporation and TransDigm Group Incorporated
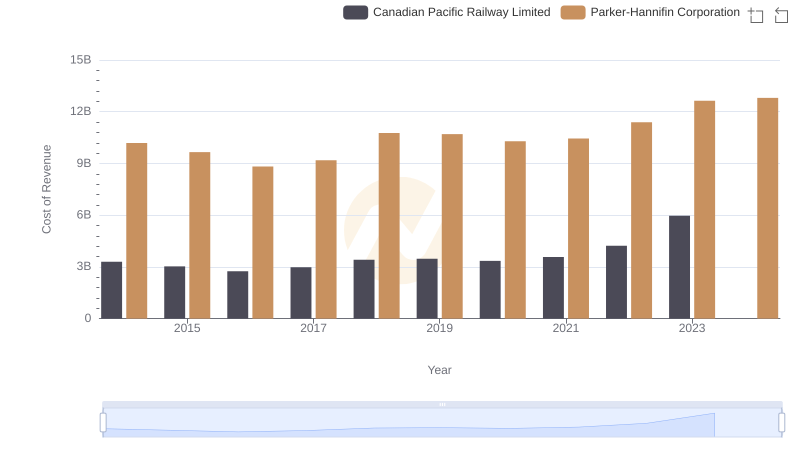
Cost of Revenue Trends: Parker-Hannifin Corporation vs Canadian Pacific Railway Limited
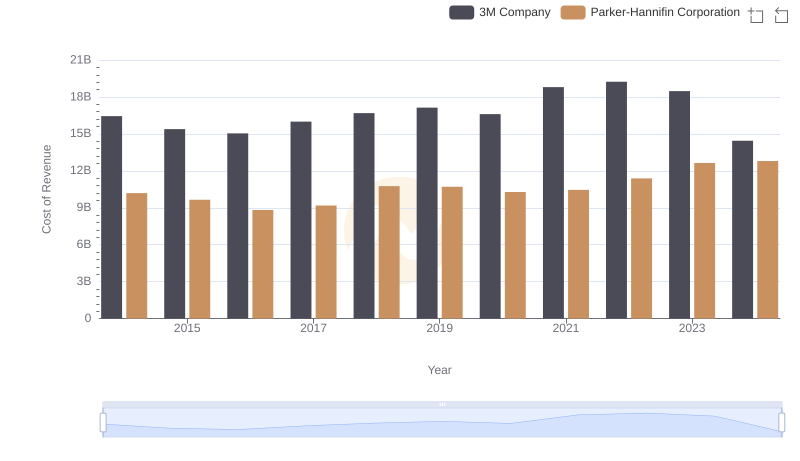
Parker-Hannifin Corporation vs 3M Company: Efficiency in Cost of Revenue Explored

Cost of Revenue Trends: Parker-Hannifin Corporation vs Illinois Tool Works Inc.
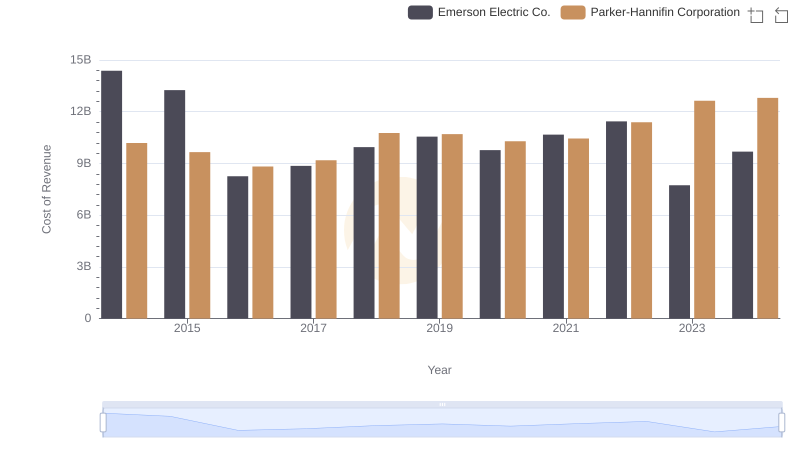
Comparing Cost of Revenue Efficiency: Parker-Hannifin Corporation vs Emerson Electric Co.
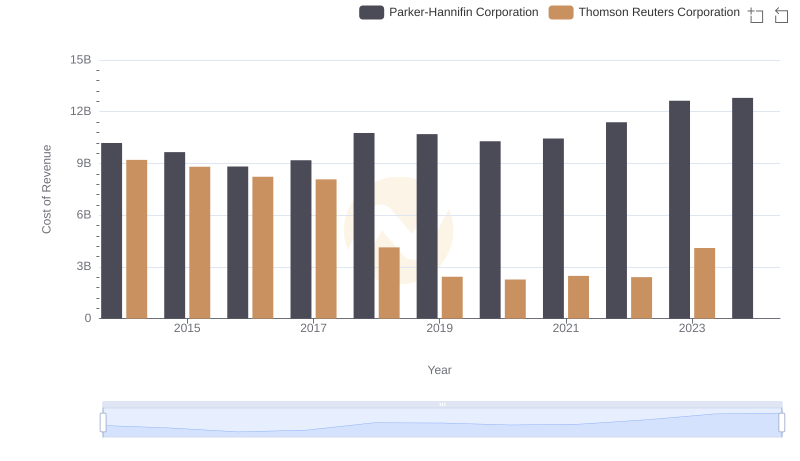
Comparing Cost of Revenue Efficiency: Parker-Hannifin Corporation vs Thomson Reuters Corporation
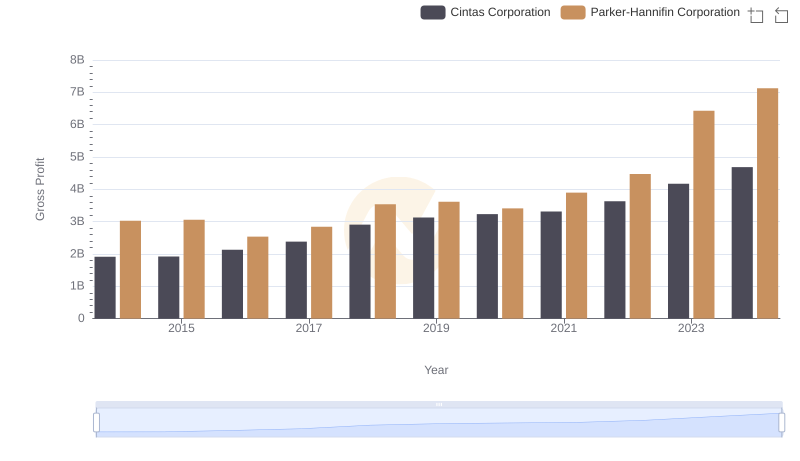
Parker-Hannifin Corporation vs Cintas Corporation: A Gross Profit Performance Breakdown
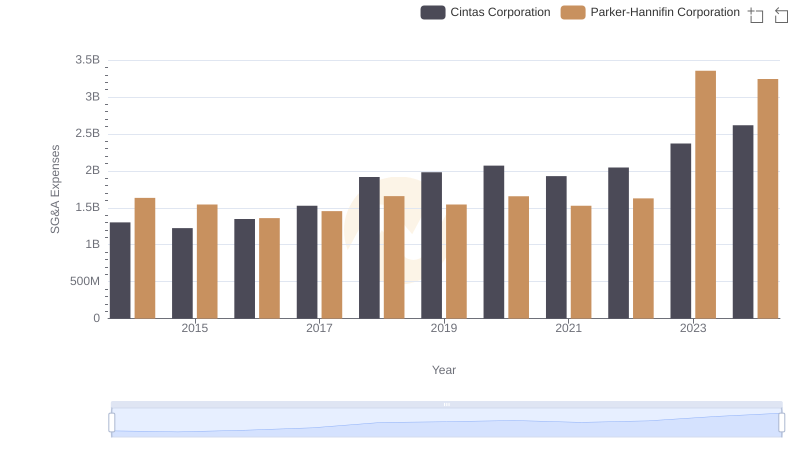
Parker-Hannifin Corporation and Cintas Corporation: SG&A Spending Patterns Compared
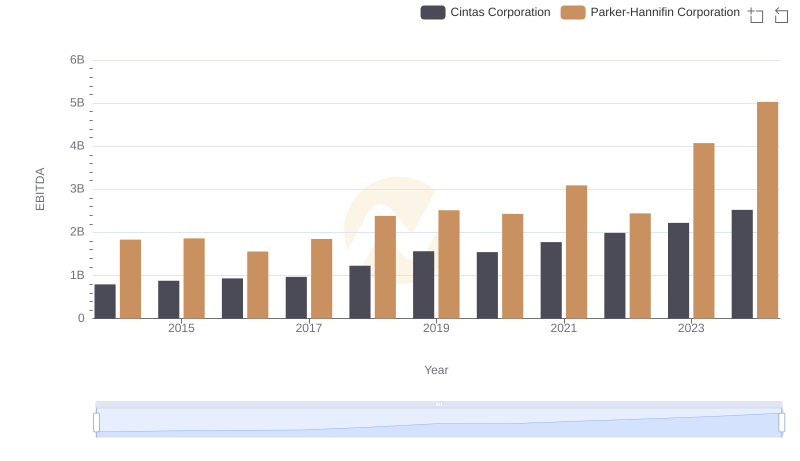
A Side-by-Side Analysis of EBITDA: Parker-Hannifin Corporation and Cintas Corporation