| __timestamp | Illinois Tool Works Inc. | Parker-Hannifin Corporation |
|---|---|---|
| Wednesday, January 1, 2014 | 2678000000 | 1633992000 |
| Thursday, January 1, 2015 | 2417000000 | 1544746000 |
| Friday, January 1, 2016 | 2415000000 | 1359360000 |
| Sunday, January 1, 2017 | 2400000000 | 1453935000 |
| Monday, January 1, 2018 | 2391000000 | 1657152000 |
| Tuesday, January 1, 2019 | 2361000000 | 1543939000 |
| Wednesday, January 1, 2020 | 2163000000 | 1656553000 |
| Friday, January 1, 2021 | 2356000000 | 1527302000 |
| Saturday, January 1, 2022 | 2579000000 | 1627116000 |
| Sunday, January 1, 2023 | 2354000000 | 3354103000 |
| Monday, January 1, 2024 | -101000000 | 3315177000 |
Unlocking the unknown
In the competitive landscape of industrial manufacturing, Parker-Hannifin Corporation and Illinois Tool Works Inc. have long been titans. Over the past decade, their Selling, General, and Administrative (SG&A) expenses reveal intriguing trends. From 2014 to 2023, Illinois Tool Works Inc. consistently maintained higher SG&A expenses, peaking in 2014 with a notable 2.68 billion. However, by 2023, Parker-Hannifin Corporation surged ahead, with expenses reaching an impressive 3.35 billion, marking a dramatic 105% increase from their 2016 low. This shift underscores Parker-Hannifin's aggressive expansion and strategic investments. Meanwhile, Illinois Tool Works Inc. experienced a more stable trajectory, with a slight dip in 2023. These financial maneuvers highlight the dynamic strategies of these industry leaders as they navigate market challenges and opportunities. Missing data for 2024 suggests ongoing developments worth watching.
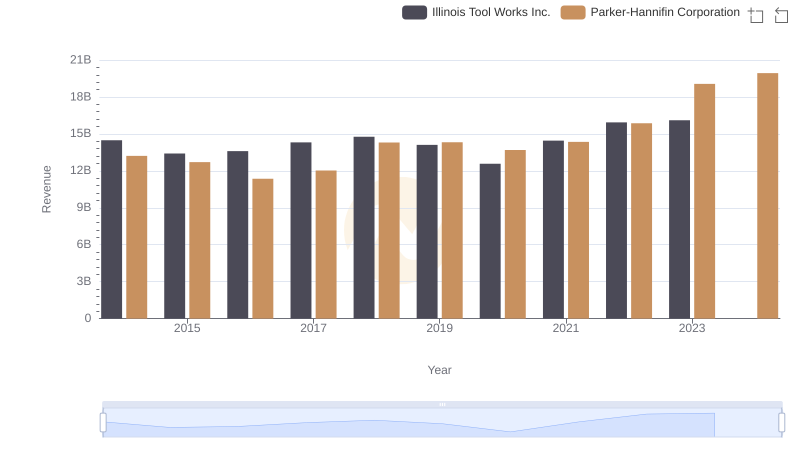
Parker-Hannifin Corporation and Illinois Tool Works Inc.: A Comprehensive Revenue Analysis

Cost of Revenue Trends: Parker-Hannifin Corporation vs Illinois Tool Works Inc.
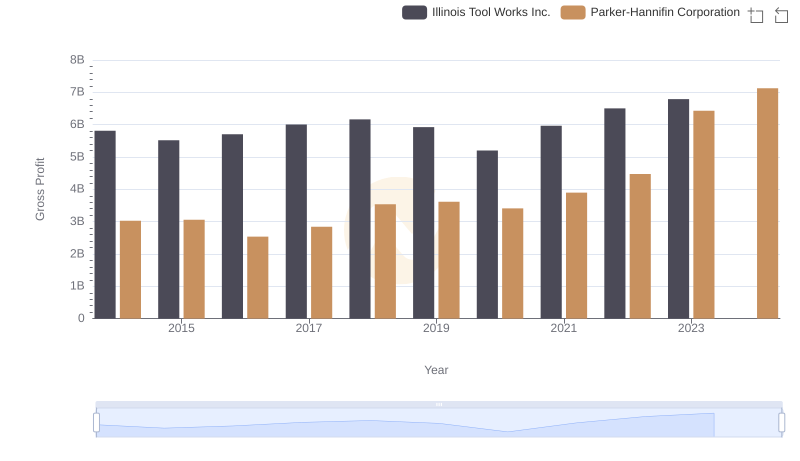
Parker-Hannifin Corporation vs Illinois Tool Works Inc.: A Gross Profit Performance Breakdown
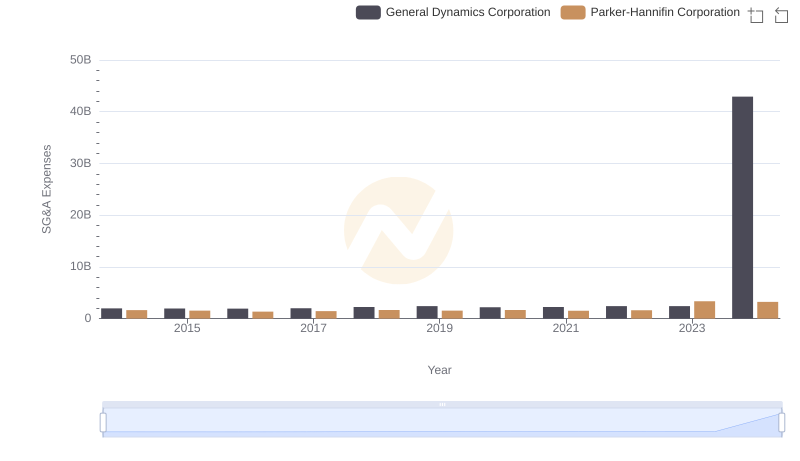
Operational Costs Compared: SG&A Analysis of Parker-Hannifin Corporation and General Dynamics Corporation
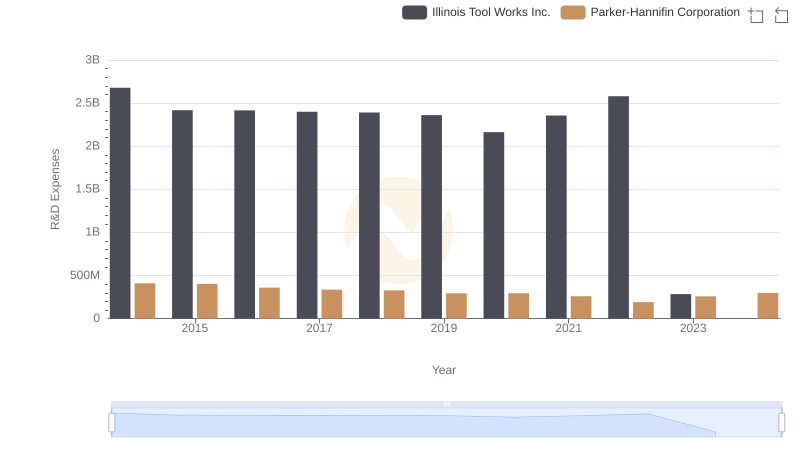
Research and Development Expenses Breakdown: Parker-Hannifin Corporation vs Illinois Tool Works Inc.
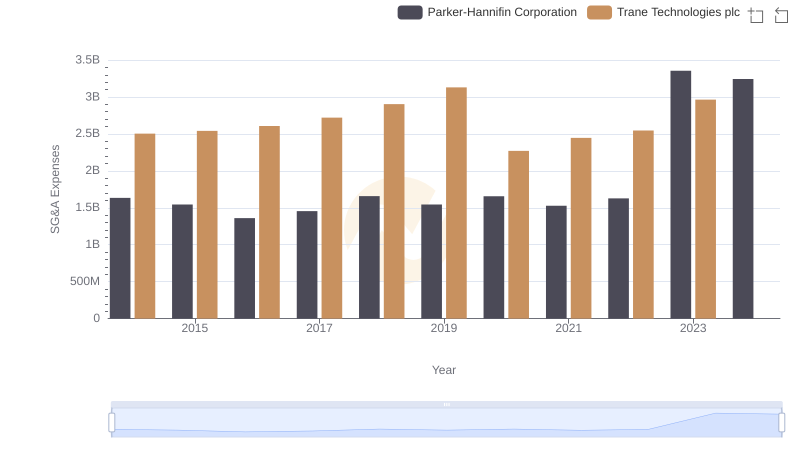
Parker-Hannifin Corporation vs Trane Technologies plc: SG&A Expense Trends
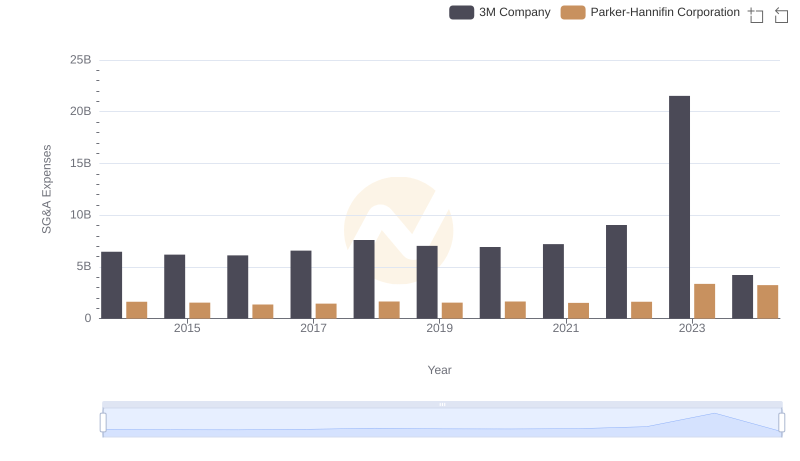
Parker-Hannifin Corporation and 3M Company: SG&A Spending Patterns Compared

EBITDA Metrics Evaluated: Parker-Hannifin Corporation vs Illinois Tool Works Inc.
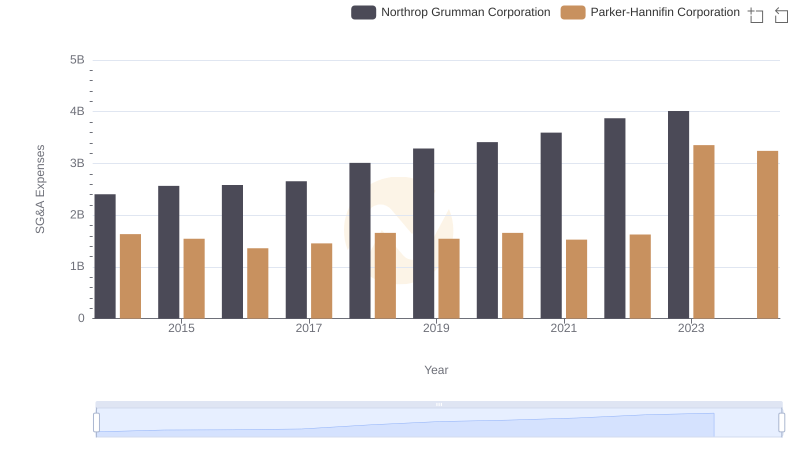
SG&A Efficiency Analysis: Comparing Parker-Hannifin Corporation and Northrop Grumman Corporation