| __timestamp | J.B. Hunt Transport Services, Inc. | Lennox International Inc. |
|---|---|---|
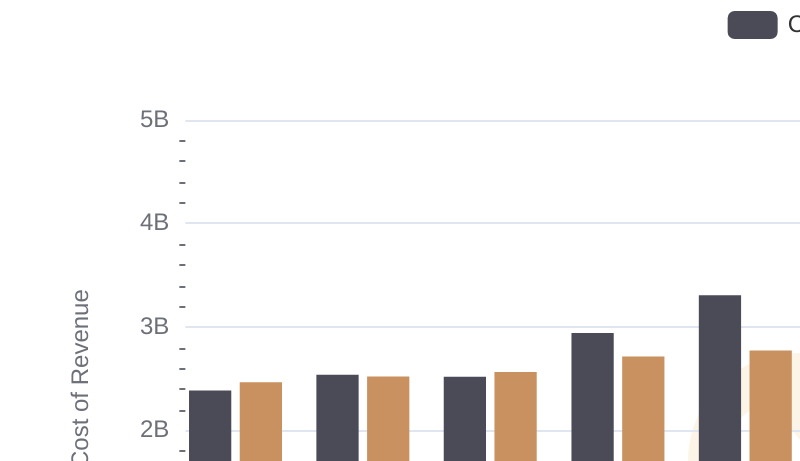
| Wednesday, January 1, 2014 | 5124095000 | 2464100000 |
| Thursday, January 1, 2015 | 5041472000 | 2520000000 |
| Friday, January 1, 2016 | 5369826000 | 2565100000 |
| Sunday, January 1, 2017 | 5990275000 | 2714400000 |
| Monday, January 1, 2018 | 7255657000 | 2772700000 |
| Tuesday, January 1, 2019 | 7659003000 | 2727400000 |
| Wednesday, January 1, 2020 | 8186697000 | 2594000000 |
| Friday, January 1, 2021 | 10298483000 | 3005700000 |
| Saturday, January 1, 2022 | 12341472000 | 3433700000 |
| Sunday, January 1, 2023 | 10433277000 | 3434100000 |
| Monday, January 1, 2024 | 3569400000 |
Data in motion
In the competitive landscape of American industry, Lennox International Inc. and J.B. Hunt Transport Services, Inc. stand as titans in their respective fields. From 2014 to 2023, J.B. Hunt's cost of revenue surged by approximately 103%, peaking in 2022, while Lennox International saw a more modest increase of around 39% over the same period. This stark contrast highlights J.B. Hunt's aggressive expansion and operational scaling, particularly in the logistics sector, where efficiency is paramount. Lennox, on the other hand, maintained a steady growth trajectory, reflecting its strategic focus on sustainable operations in the HVAC industry. Notably, 2024 data for J.B. Hunt is missing, leaving room for speculation on its future performance. As these companies navigate economic challenges, their cost management strategies will be crucial in maintaining competitive advantages.
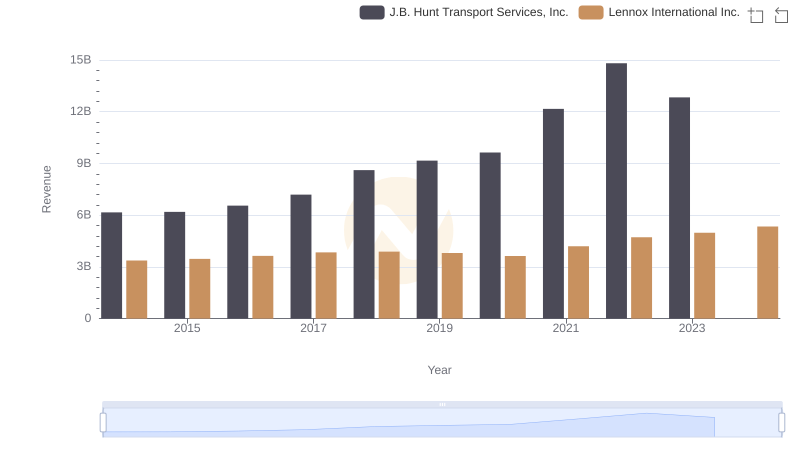
Lennox International Inc. or J.B. Hunt Transport Services, Inc.: Who Leads in Yearly Revenue?
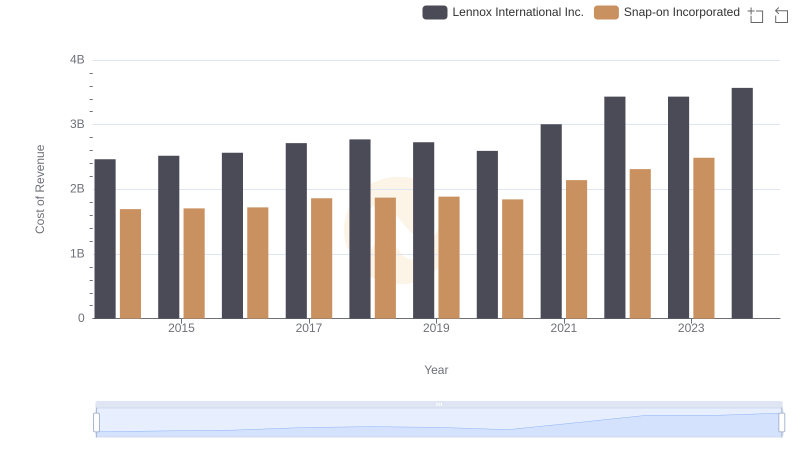
Cost Insights: Breaking Down Lennox International Inc. and Snap-on Incorporated's Expenses
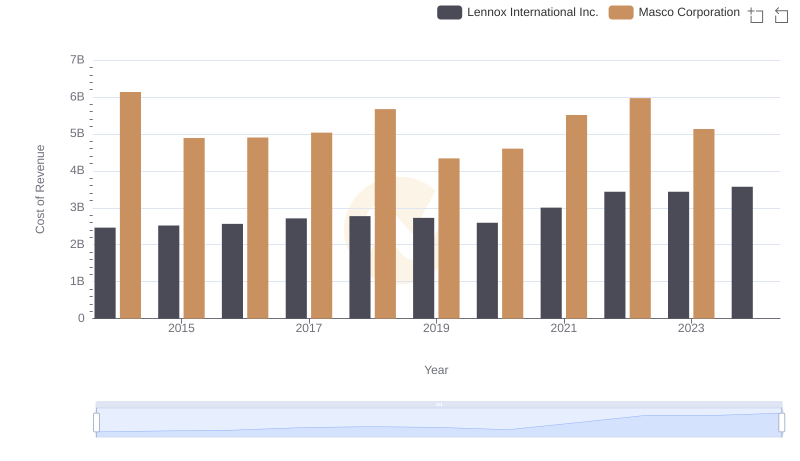
Analyzing Cost of Revenue: Lennox International Inc. and Masco Corporation
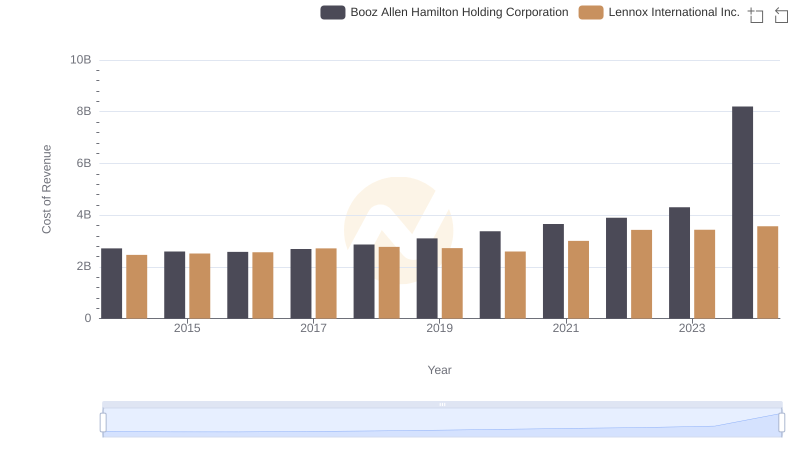
Analyzing Cost of Revenue: Lennox International Inc. and Booz Allen Hamilton Holding Corporation
Comparing Cost of Revenue Efficiency: Lennox International Inc. vs Carlisle Companies Incorporated
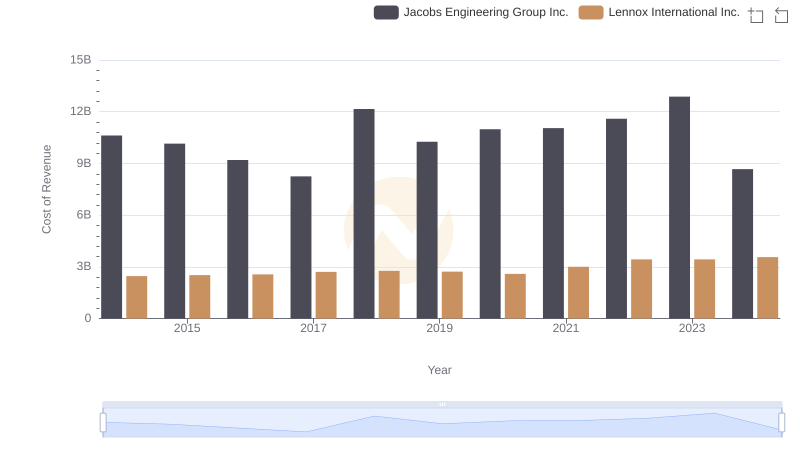
Cost of Revenue Trends: Lennox International Inc. vs Jacobs Engineering Group Inc.
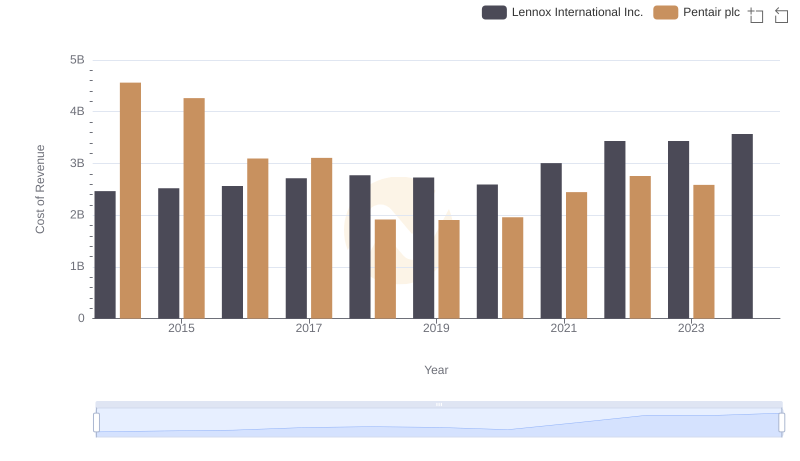
Cost Insights: Breaking Down Lennox International Inc. and Pentair plc's Expenses
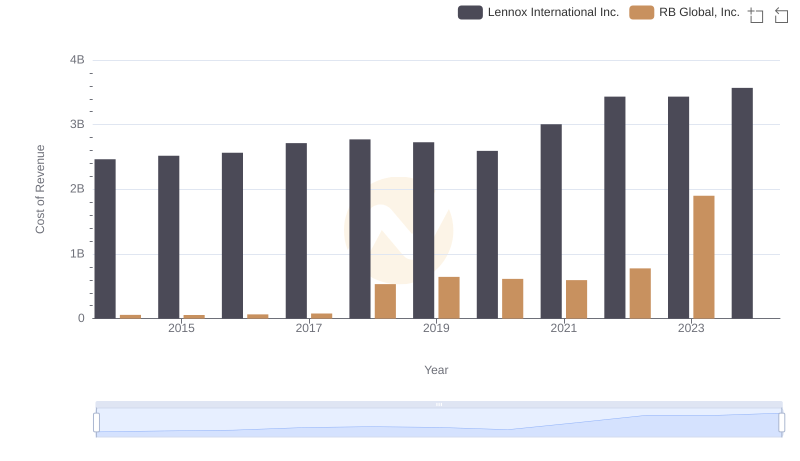
Cost of Revenue Comparison: Lennox International Inc. vs RB Global, Inc.
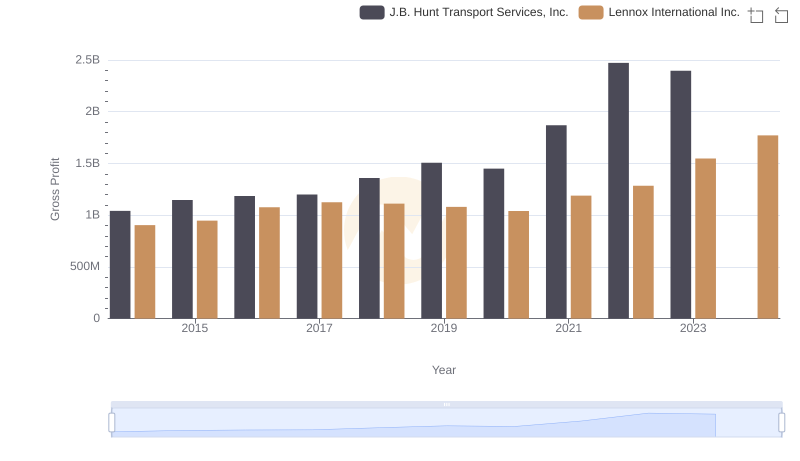
Lennox International Inc. and J.B. Hunt Transport Services, Inc.: A Detailed Gross Profit Analysis
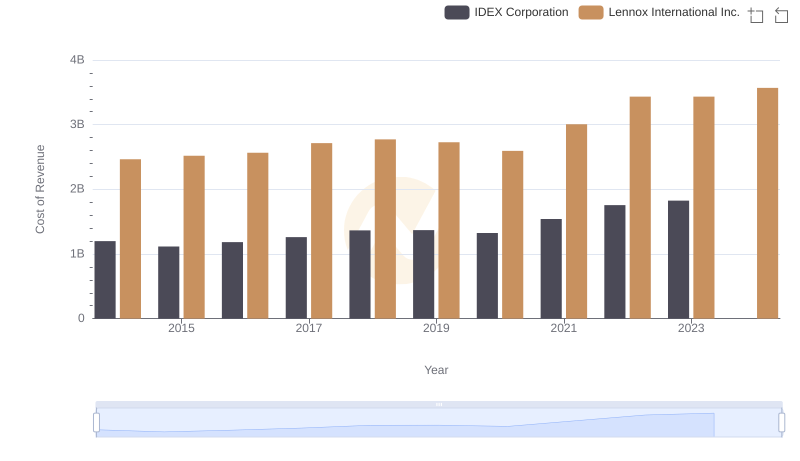
Cost of Revenue Trends: Lennox International Inc. vs IDEX Corporation
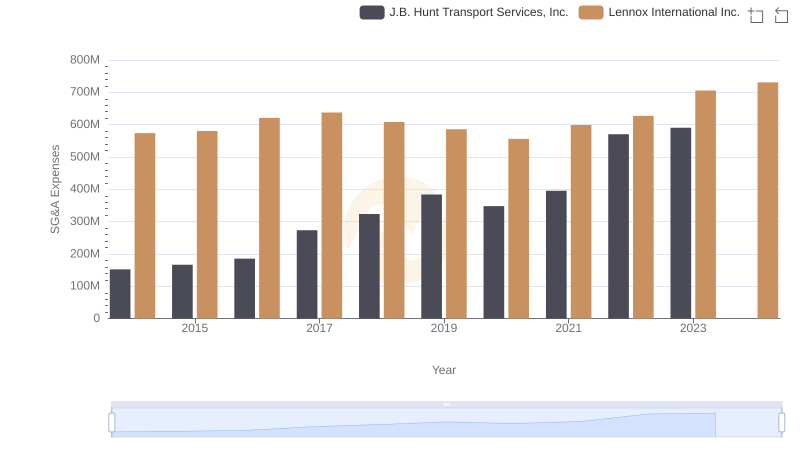
SG&A Efficiency Analysis: Comparing Lennox International Inc. and J.B. Hunt Transport Services, Inc.
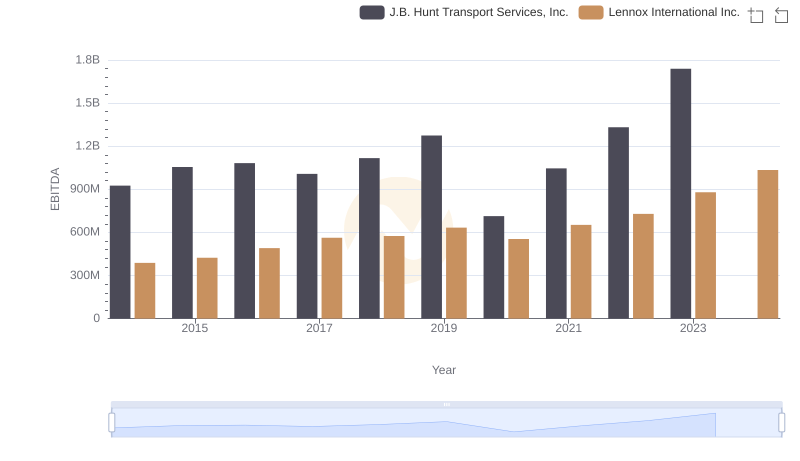
EBITDA Metrics Evaluated: Lennox International Inc. vs J.B. Hunt Transport Services, Inc.