| __timestamp | EMCOR Group, Inc. | Stanley Black & Decker, Inc. |
|---|---|---|
| Wednesday, January 1, 2014 | 907246000 | 4102700000 |
| Thursday, January 1, 2015 | 944479000 | 4072000000 |
| Friday, January 1, 2016 | 1037862000 | 4267200000 |
| Sunday, January 1, 2017 | 1147012000 | 4778000000 |
| Monday, January 1, 2018 | 1205453000 | 4901900000 |
| Tuesday, January 1, 2019 | 1355868000 | 4805500000 |
| Wednesday, January 1, 2020 | 1395382000 | 4967900000 |
| Friday, January 1, 2021 | 1501737000 | 5194200000 |
| Saturday, January 1, 2022 | 1603594000 | 4284100000 |
| Sunday, January 1, 2023 | 2089339000 | 4098000000 |
| Monday, January 1, 2024 | 4514400000 |
Igniting the spark of knowledge
In the competitive landscape of industrial and construction services, EMCOR Group, Inc. and Stanley Black & Decker, Inc. have been pivotal players. Over the past decade, EMCOR has seen a remarkable growth in its gross profit, surging by approximately 130% from 2014 to 2023. This growth trajectory highlights EMCOR's strategic prowess in navigating market challenges and capitalizing on opportunities.
Conversely, Stanley Black & Decker, Inc. experienced a more volatile journey. While it reached a peak gross profit in 2021, the subsequent years saw a decline of about 21%, reflecting potential market shifts or strategic realignments. This contrast underscores the dynamic nature of the industry and the varying strategies employed by these two giants.
As we delve into these insights, it becomes evident that adaptability and strategic foresight are key to thriving in this ever-evolving sector.
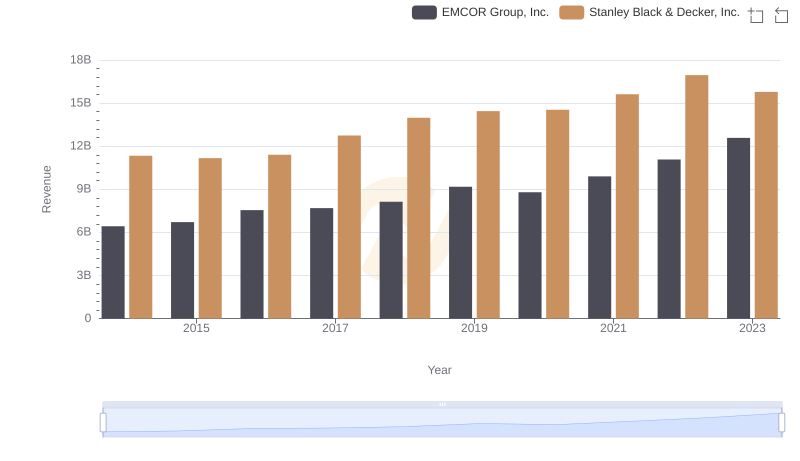
Annual Revenue Comparison: EMCOR Group, Inc. vs Stanley Black & Decker, Inc.
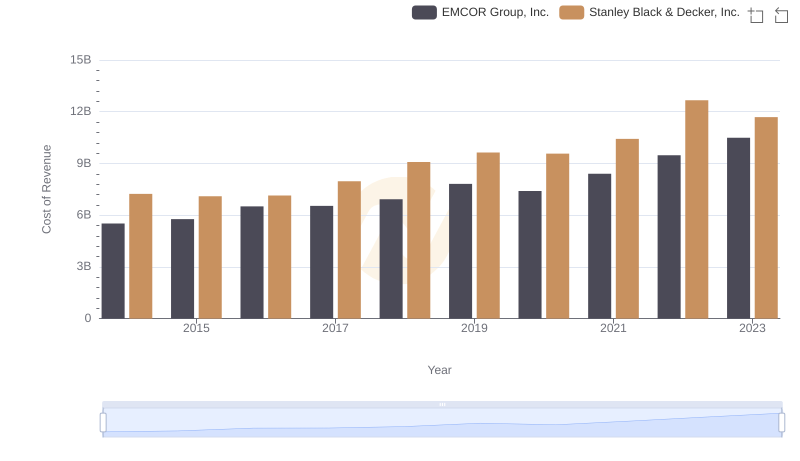
Cost of Revenue Trends: EMCOR Group, Inc. vs Stanley Black & Decker, Inc.
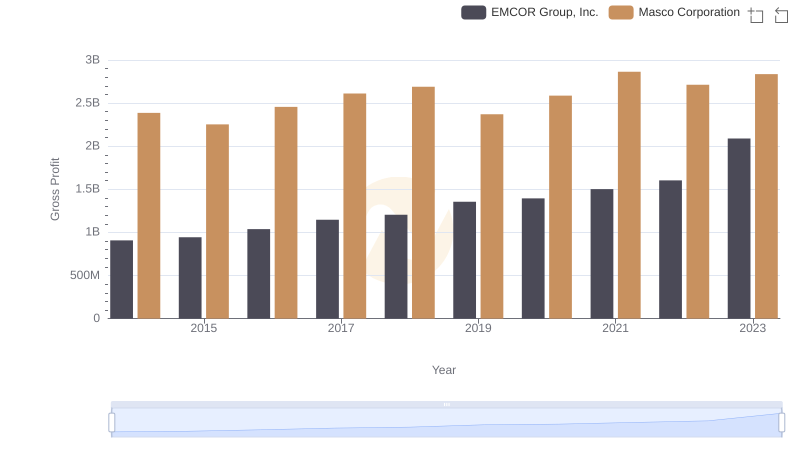
Gross Profit Trends Compared: EMCOR Group, Inc. vs Masco Corporation
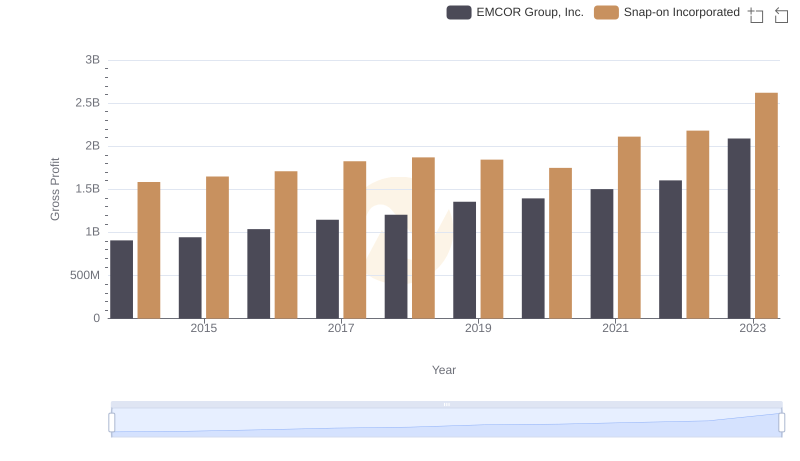
Gross Profit Comparison: EMCOR Group, Inc. and Snap-on Incorporated Trends
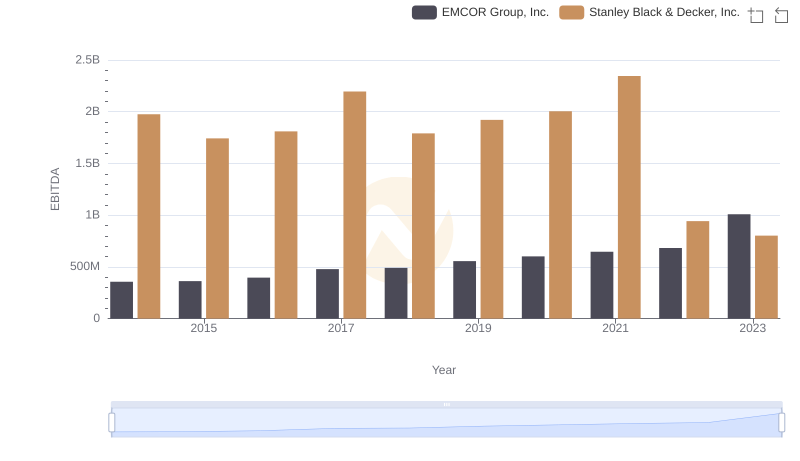
A Professional Review of EBITDA: EMCOR Group, Inc. Compared to Stanley Black & Decker, Inc.
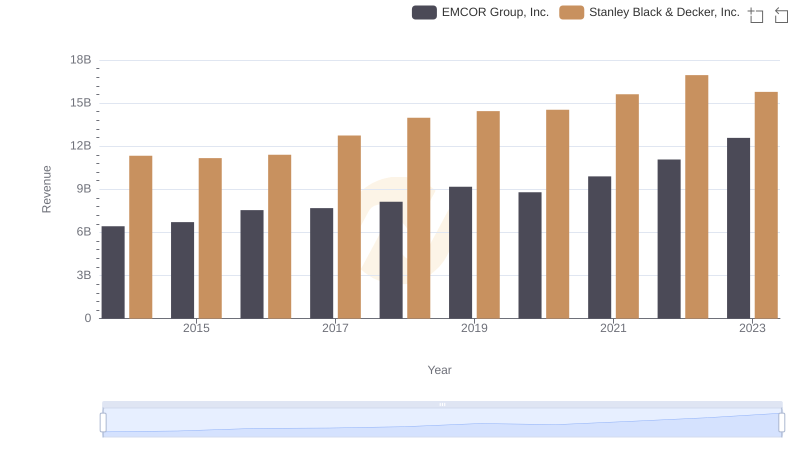
EMCOR Group, Inc. or Stanley Black & Decker, Inc.: Who Leads in Yearly Revenue?
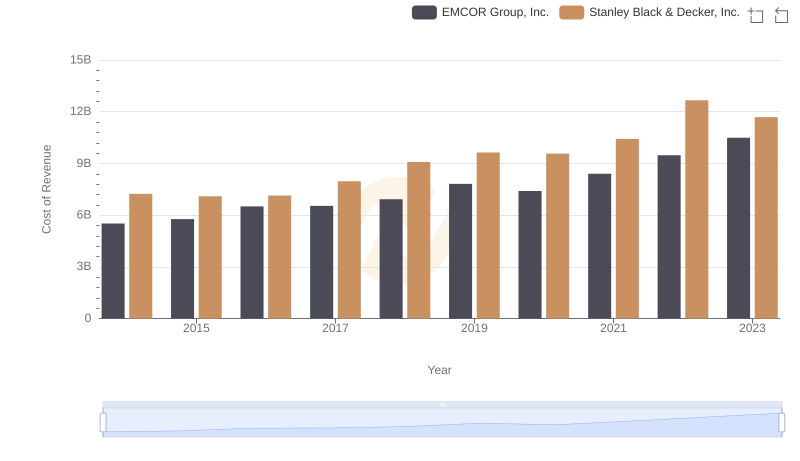
Cost of Revenue: Key Insights for EMCOR Group, Inc. and Stanley Black & Decker, Inc.
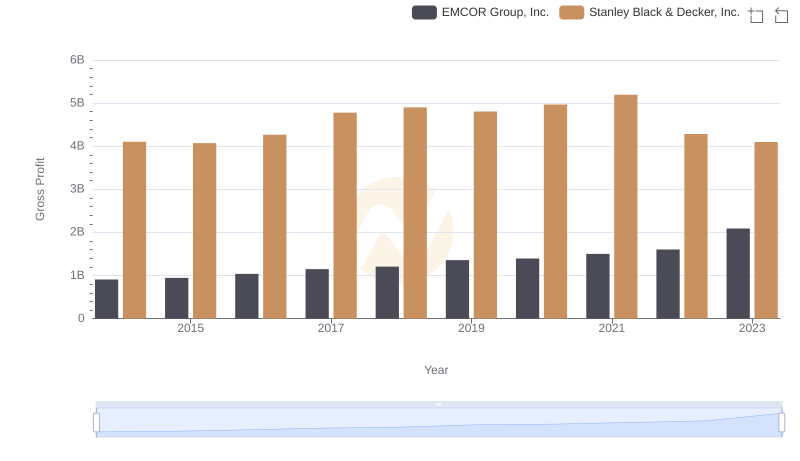
Gross Profit Comparison: EMCOR Group, Inc. and Stanley Black & Decker, Inc. Trends
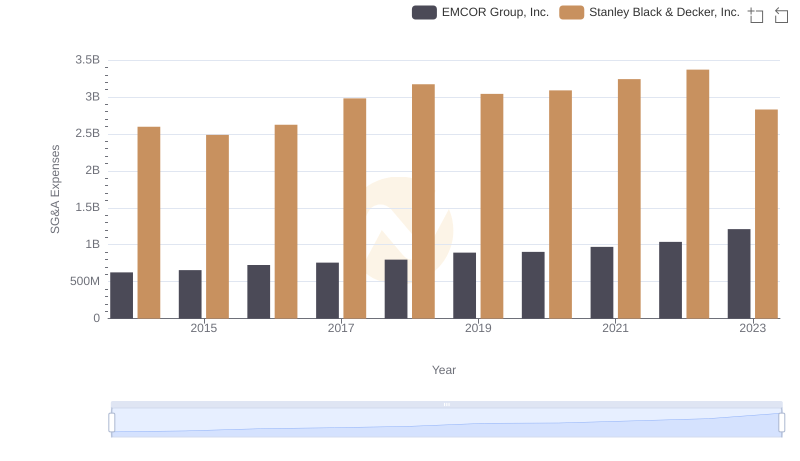
Selling, General, and Administrative Costs: EMCOR Group, Inc. vs Stanley Black & Decker, Inc.
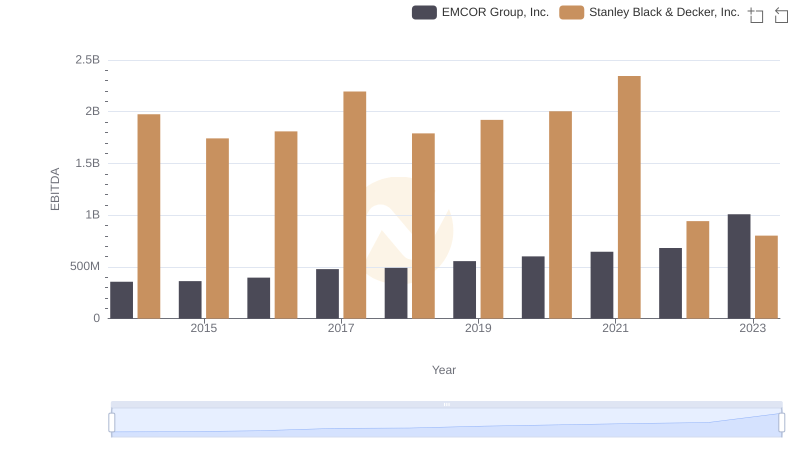
EMCOR Group, Inc. and Stanley Black & Decker, Inc.: A Detailed Examination of EBITDA Performance