| __timestamp | EMCOR Group, Inc. | RB Global, Inc. |
|---|---|---|
| Wednesday, January 1, 2014 | 5517719000 | 57884000 |
| Thursday, January 1, 2015 | 5774247000 | 56026000 |
| Friday, January 1, 2016 | 6513662000 | 66062000 |
| Sunday, January 1, 2017 | 6539987000 | 79013000 |
| Monday, January 1, 2018 | 6925178000 | 533397000 |
| Tuesday, January 1, 2019 | 7818743000 | 645816000 |
| Wednesday, January 1, 2020 | 7401679000 | 615589000 |
| Friday, January 1, 2021 | 8401843000 | 594783000 |
| Saturday, January 1, 2022 | 9472526000 | 776701000 |
| Sunday, January 1, 2023 | 10493534000 | 1901200000 |
| Monday, January 1, 2024 | 0 |
Unleashing insights
In the competitive landscape of industrial services, cost efficiency is a critical metric. Over the past decade, EMCOR Group, Inc. has demonstrated a robust growth trajectory in managing its cost of revenue. From 2014 to 2023, EMCOR's cost of revenue surged by approximately 90%, reflecting its expanding operations and market presence. In contrast, RB Global, Inc. has shown a more modest increase of around 3200% in the same period, indicating a different growth strategy or market conditions.
The data reveals that EMCOR consistently maintained a higher cost of revenue, peaking at $10.5 billion in 2023, compared to RB Global's $1.9 billion. This disparity highlights EMCOR's larger scale and possibly more extensive service offerings. However, RB Global's significant percentage increase suggests a rapid scaling or diversification strategy. Understanding these trends provides valuable insights into each company's operational efficiency and strategic direction.
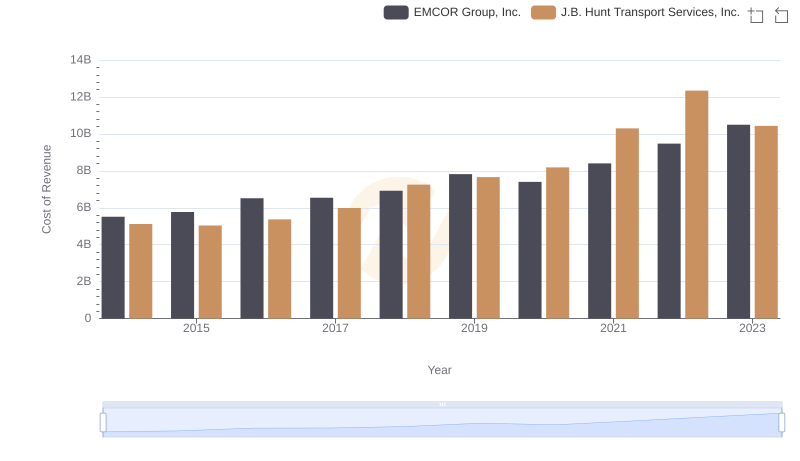
Cost of Revenue: Key Insights for EMCOR Group, Inc. and J.B. Hunt Transport Services, Inc.
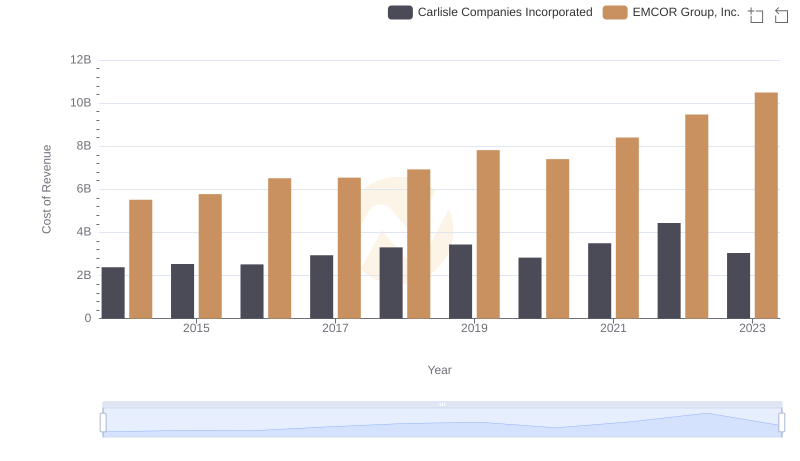
Comparing Cost of Revenue Efficiency: EMCOR Group, Inc. vs Carlisle Companies Incorporated
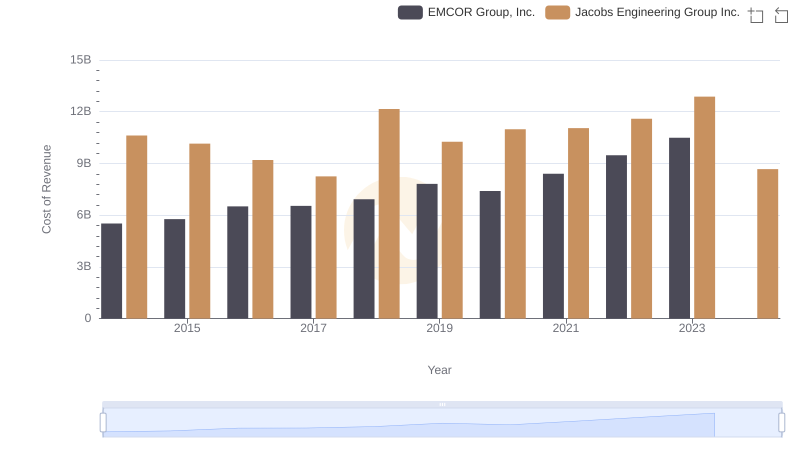
EMCOR Group, Inc. vs Jacobs Engineering Group Inc.: Efficiency in Cost of Revenue Explored
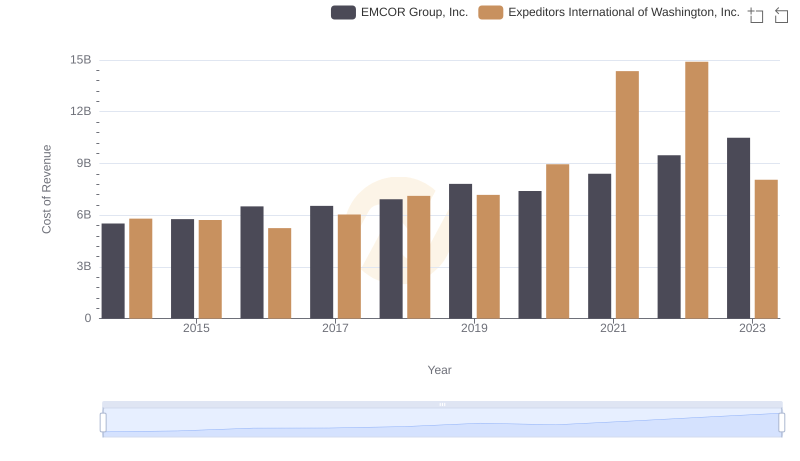
Cost of Revenue: Key Insights for EMCOR Group, Inc. and Expeditors International of Washington, Inc.
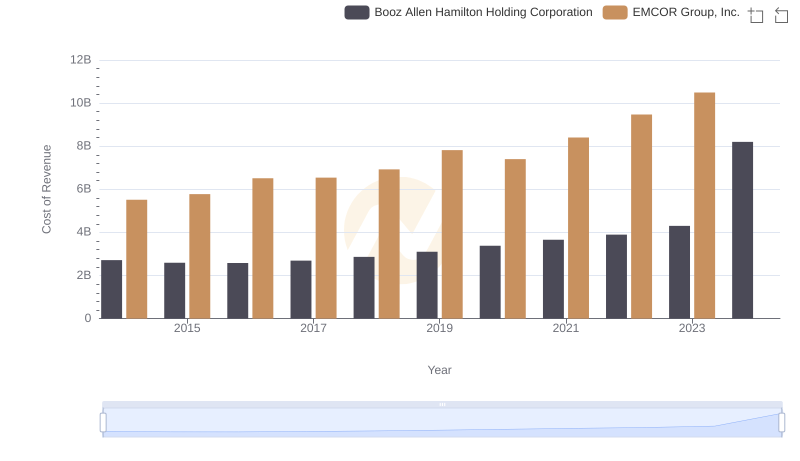
Cost of Revenue Trends: EMCOR Group, Inc. vs Booz Allen Hamilton Holding Corporation
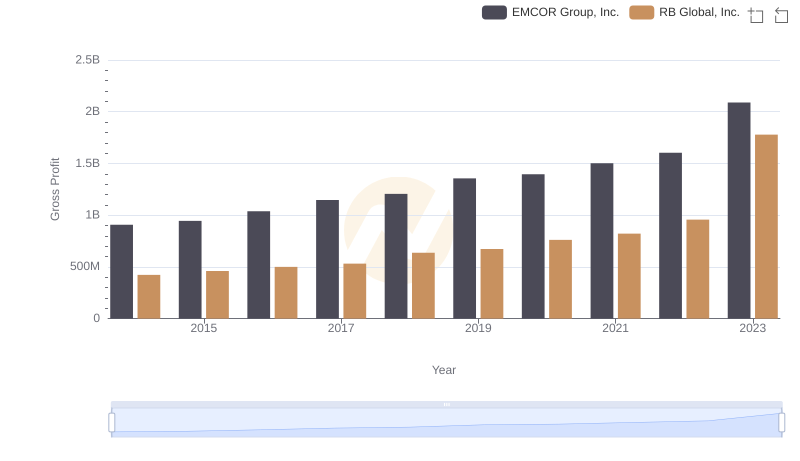
EMCOR Group, Inc. and RB Global, Inc.: A Detailed Gross Profit Analysis
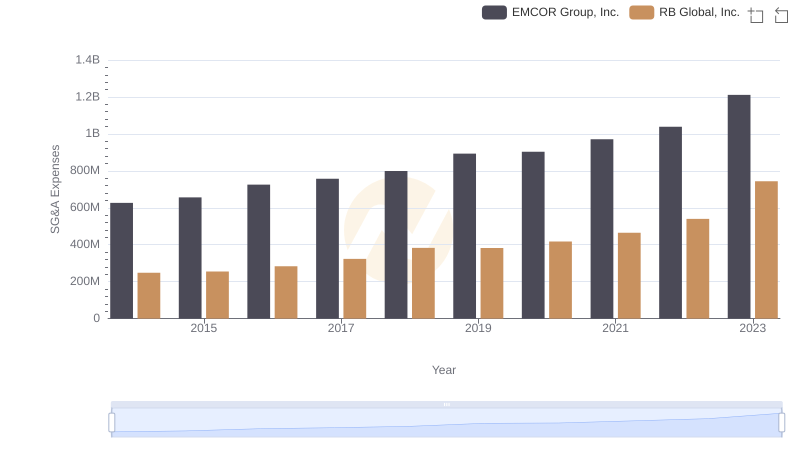
EMCOR Group, Inc. and RB Global, Inc.: SG&A Spending Patterns Compared