| __timestamp | AECOM | EMCOR Group, Inc. |
|---|---|---|
| Wednesday, January 1, 2014 | 80908000 | 626478000 |
| Thursday, January 1, 2015 | 113975000 | 656573000 |
| Friday, January 1, 2016 | 115088000 | 725538000 |
| Sunday, January 1, 2017 | 133309000 | 757062000 |
| Monday, January 1, 2018 | 135787000 | 799157000 |
| Tuesday, January 1, 2019 | 148123000 | 893453000 |
| Wednesday, January 1, 2020 | 188535000 | 903584000 |
| Friday, January 1, 2021 | 155072000 | 970937000 |
| Saturday, January 1, 2022 | 147309000 | 1038717000 |
| Sunday, January 1, 2023 | 153575000 | 1211233000 |
| Monday, January 1, 2024 | 160105000 |
Unleashing insights
In the competitive landscape of engineering and construction, understanding the financial health of industry leaders is crucial. Over the past decade, AECOM and EMCOR Group, Inc. have shown distinct trends in their Selling, General, and Administrative (SG&A) expenses. From 2014 to 2023, AECOM's SG&A expenses grew by approximately 98%, reflecting strategic investments and expansion efforts. In contrast, EMCOR Group, Inc. experienced a 93% increase, indicating robust operational scaling.
These insights offer a window into the strategic priorities of these industry titans.
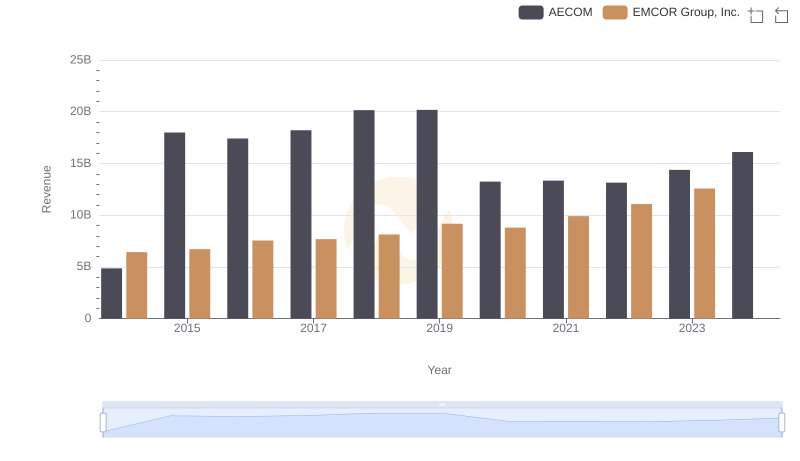
Revenue Insights: EMCOR Group, Inc. and AECOM Performance Compared
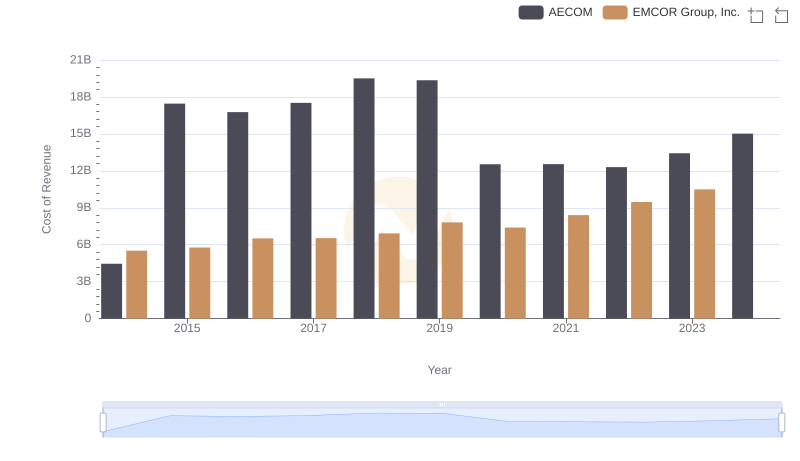
Cost of Revenue Trends: EMCOR Group, Inc. vs AECOM
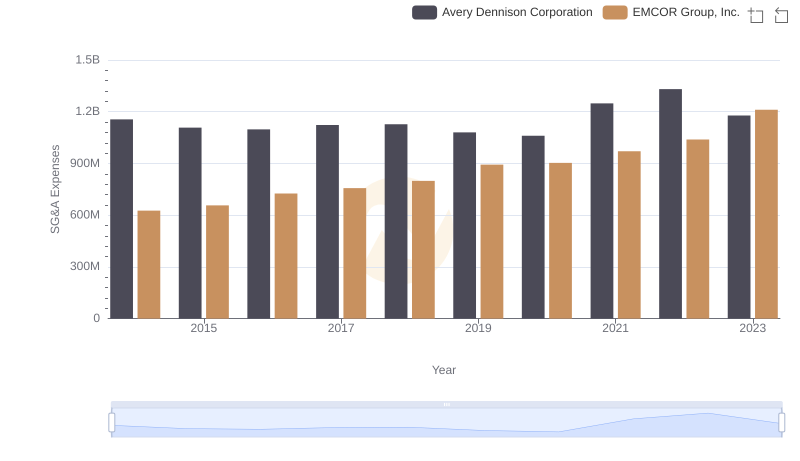
Breaking Down SG&A Expenses: EMCOR Group, Inc. vs Avery Dennison Corporation
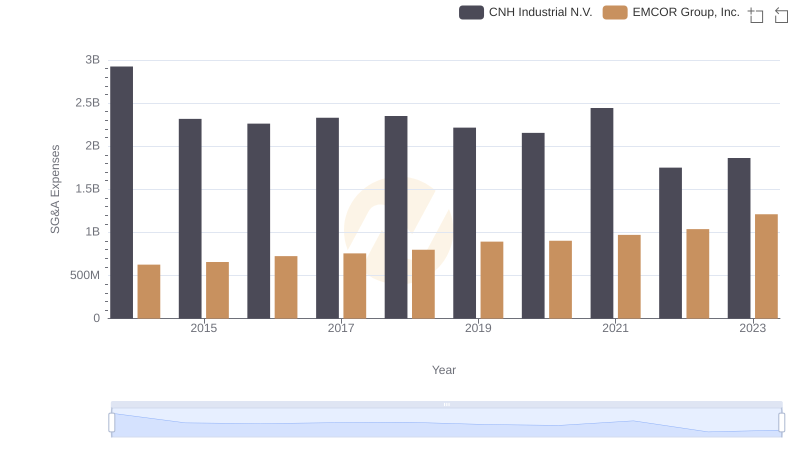
EMCOR Group, Inc. or CNH Industrial N.V.: Who Manages SG&A Costs Better?
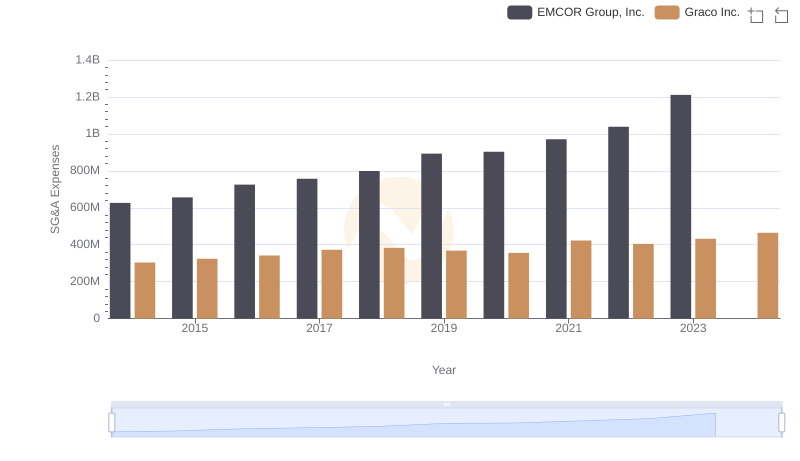
Breaking Down SG&A Expenses: EMCOR Group, Inc. vs Graco Inc.
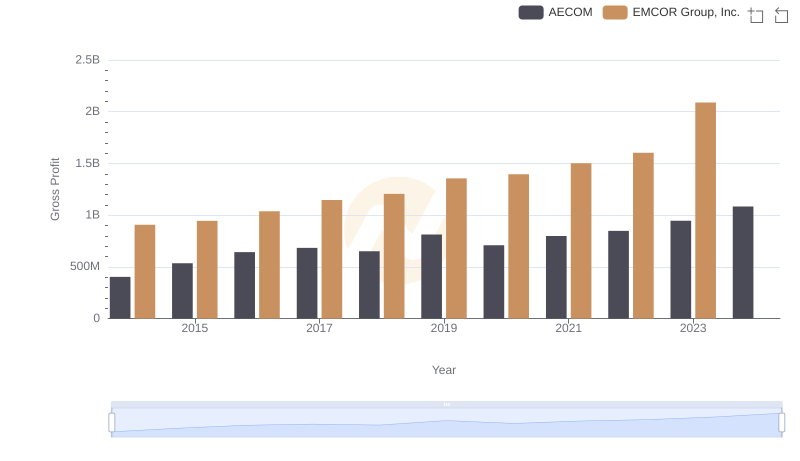
Who Generates Higher Gross Profit? EMCOR Group, Inc. or AECOM
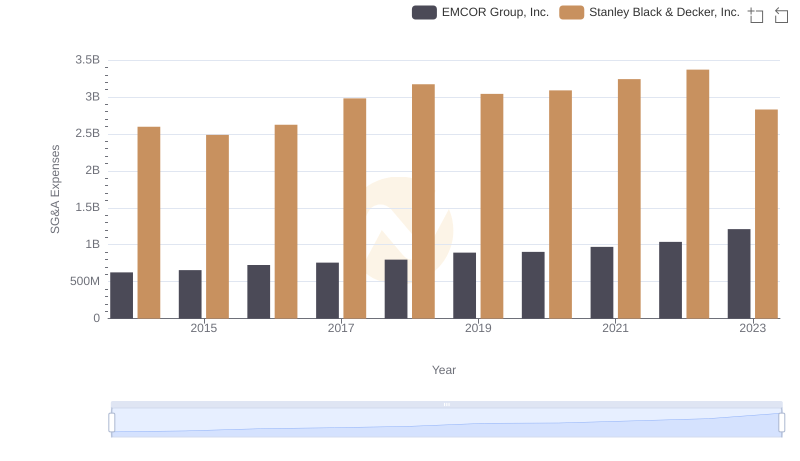
Selling, General, and Administrative Costs: EMCOR Group, Inc. vs Stanley Black & Decker, Inc.
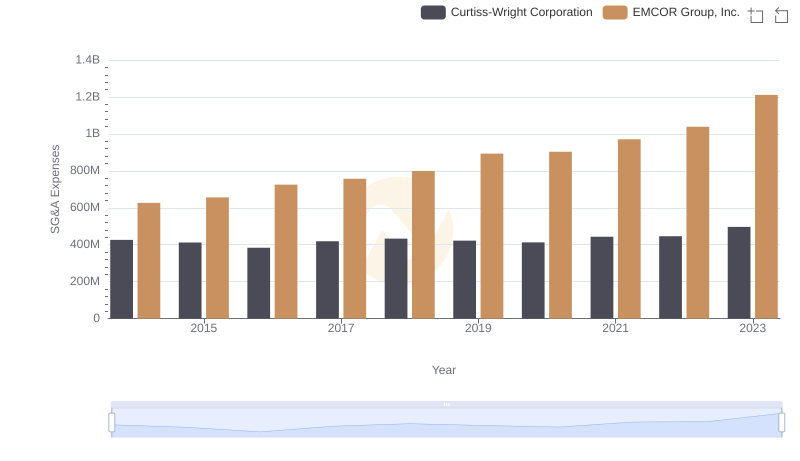
EMCOR Group, Inc. vs Curtiss-Wright Corporation: SG&A Expense Trends
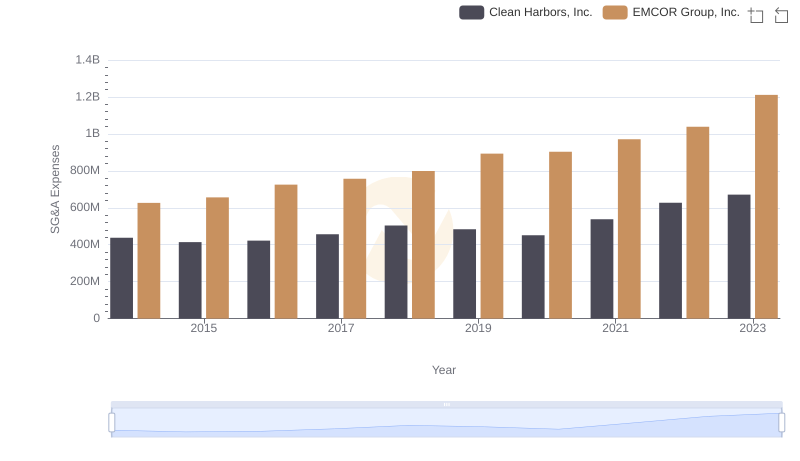
EMCOR Group, Inc. and Clean Harbors, Inc.: SG&A Spending Patterns Compared
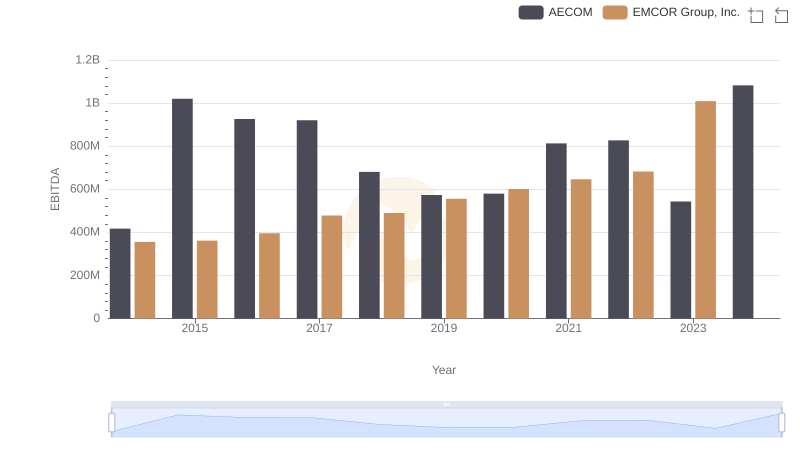
Comprehensive EBITDA Comparison: EMCOR Group, Inc. vs AECOM