| __timestamp | Curtiss-Wright Corporation | EMCOR Group, Inc. |
|---|---|---|
| Wednesday, January 1, 2014 | 1466610000 | 5517719000 |
| Thursday, January 1, 2015 | 1422428000 | 5774247000 |
| Friday, January 1, 2016 | 1358448000 | 6513662000 |
| Sunday, January 1, 2017 | 1452431000 | 6539987000 |
| Monday, January 1, 2018 | 1540574000 | 6925178000 |
| Tuesday, January 1, 2019 | 1589216000 | 7818743000 |
| Wednesday, January 1, 2020 | 1550109000 | 7401679000 |
| Friday, January 1, 2021 | 1572575000 | 8401843000 |
| Saturday, January 1, 2022 | 1602416000 | 9472526000 |
| Sunday, January 1, 2023 | 1778195000 | 10493534000 |
| Monday, January 1, 2024 | 1967640000 |
Igniting the spark of knowledge
In the competitive landscape of industrial services, EMCOR Group, Inc. and Curtiss-Wright Corporation stand as titans. Over the past decade, from 2014 to 2023, these companies have showcased their prowess in managing cost of revenue, a critical metric for operational efficiency. EMCOR Group, Inc. has consistently outperformed, with its cost of revenue growing from approximately $5.5 billion in 2014 to over $10 billion in 2023, marking an impressive 90% increase. In contrast, Curtiss-Wright Corporation's cost of revenue rose from about $1.47 billion to $1.78 billion, a more modest 21% increase. This stark difference highlights EMCOR's aggressive expansion and operational scale. As the industry evolves, these figures underscore the importance of strategic cost management in maintaining competitive advantage.
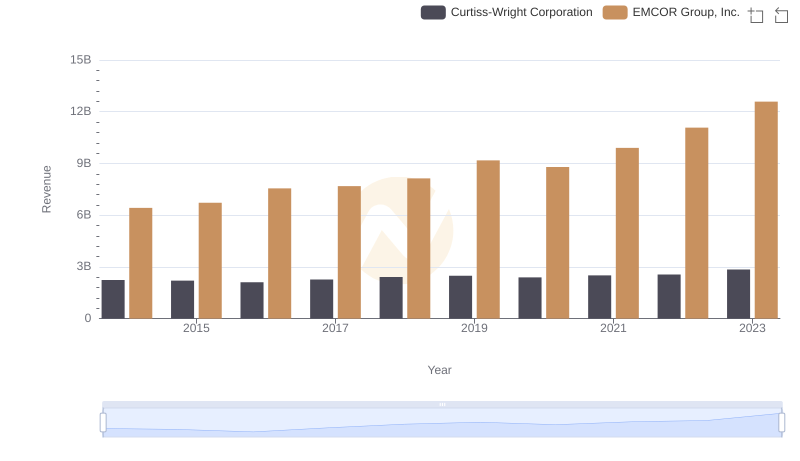
Comparing Revenue Performance: EMCOR Group, Inc. or Curtiss-Wright Corporation?
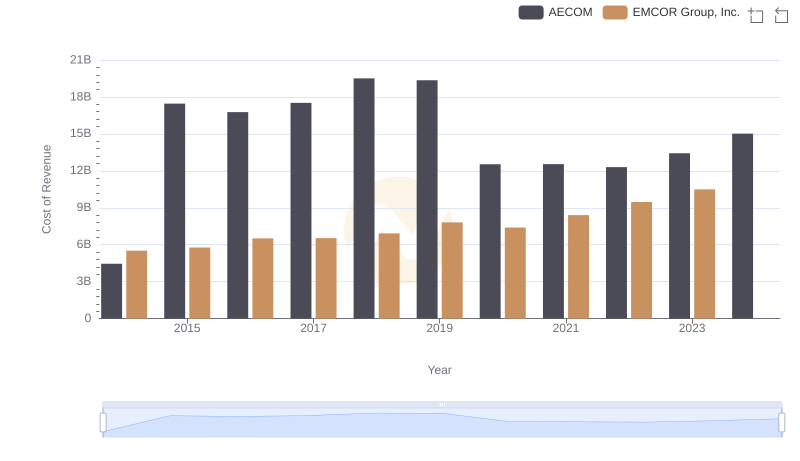
Cost of Revenue Trends: EMCOR Group, Inc. vs AECOM

Comparing Cost of Revenue Efficiency: EMCOR Group, Inc. vs Saia, Inc.
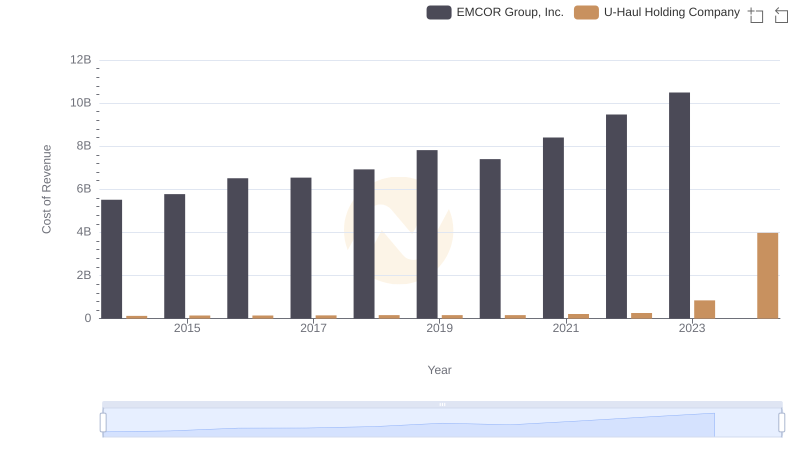
EMCOR Group, Inc. vs U-Haul Holding Company: Efficiency in Cost of Revenue Explored
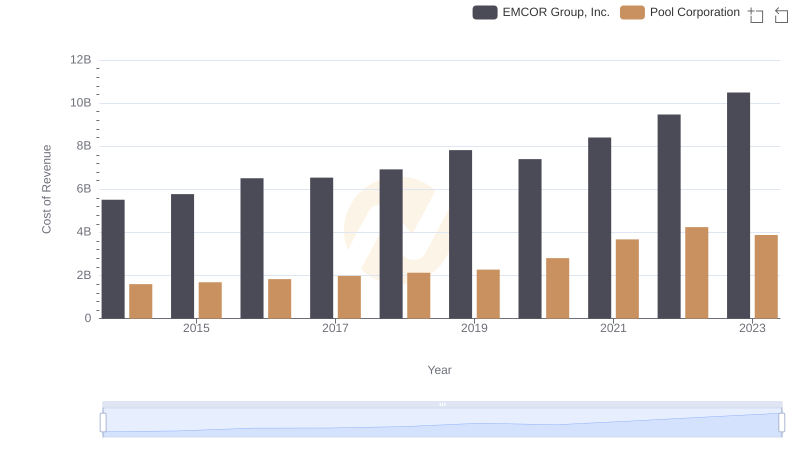
Cost of Revenue Comparison: EMCOR Group, Inc. vs Pool Corporation
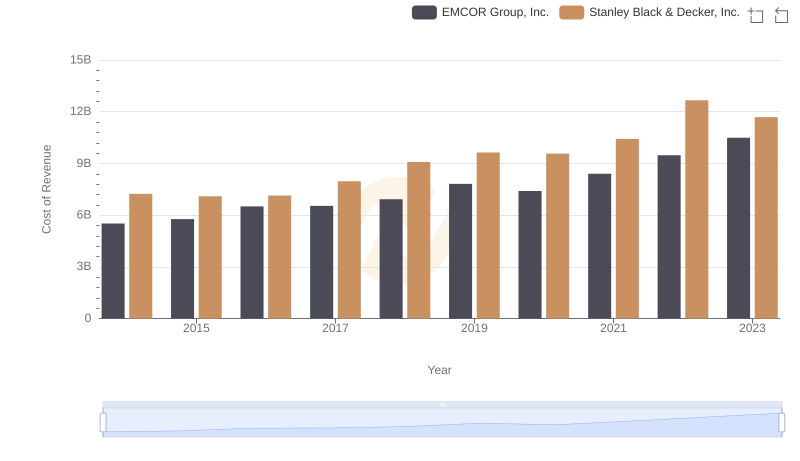
Cost of Revenue: Key Insights for EMCOR Group, Inc. and Stanley Black & Decker, Inc.
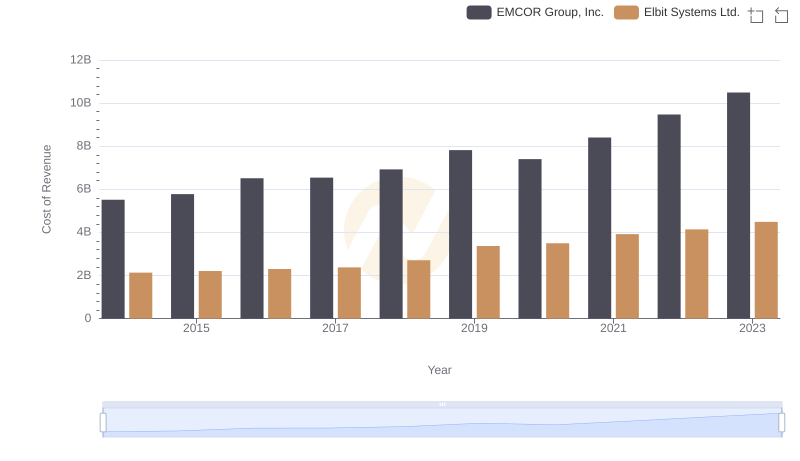
Cost of Revenue Trends: EMCOR Group, Inc. vs Elbit Systems Ltd.
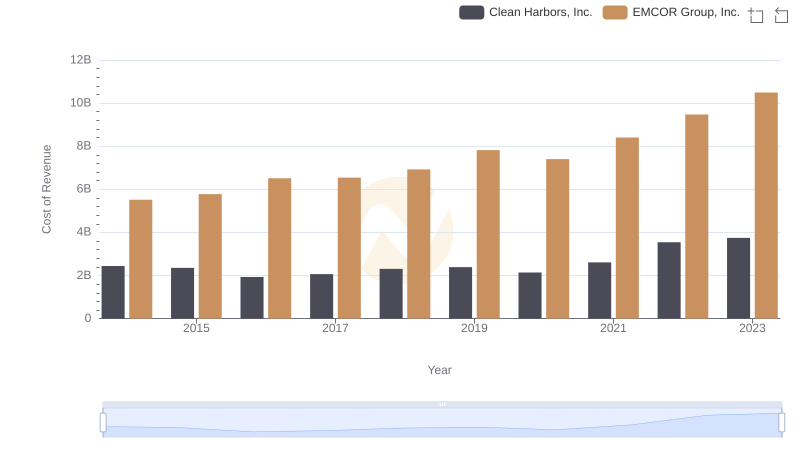
Cost of Revenue Trends: EMCOR Group, Inc. vs Clean Harbors, Inc.
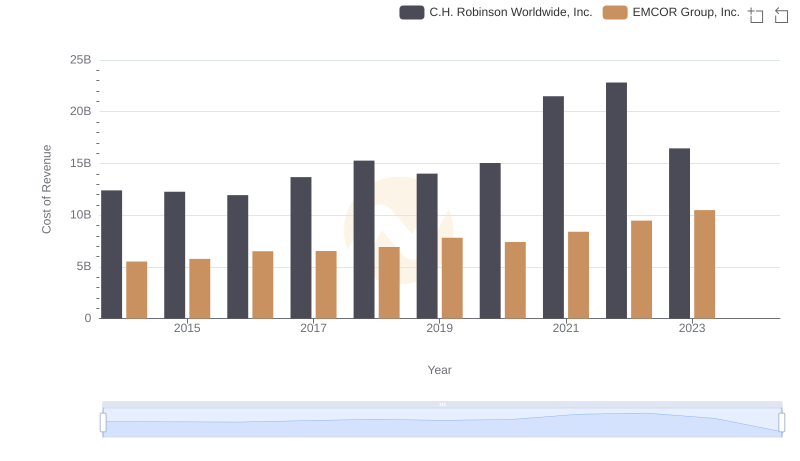
Cost of Revenue Comparison: EMCOR Group, Inc. vs C.H. Robinson Worldwide, Inc.
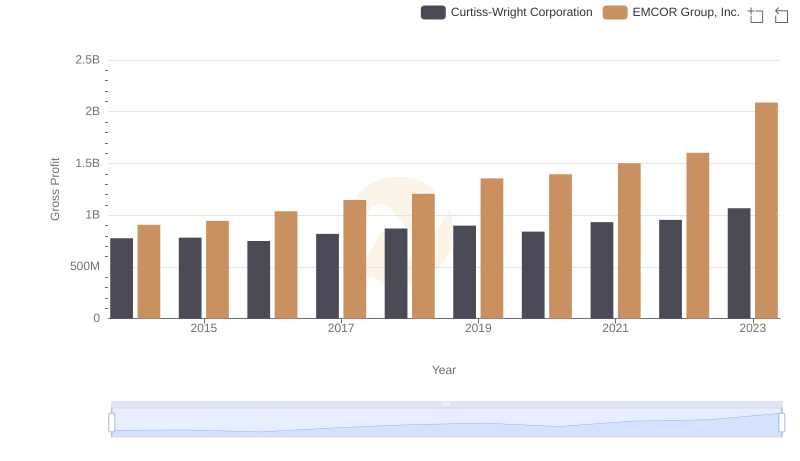
EMCOR Group, Inc. and Curtiss-Wright Corporation: A Detailed Gross Profit Analysis
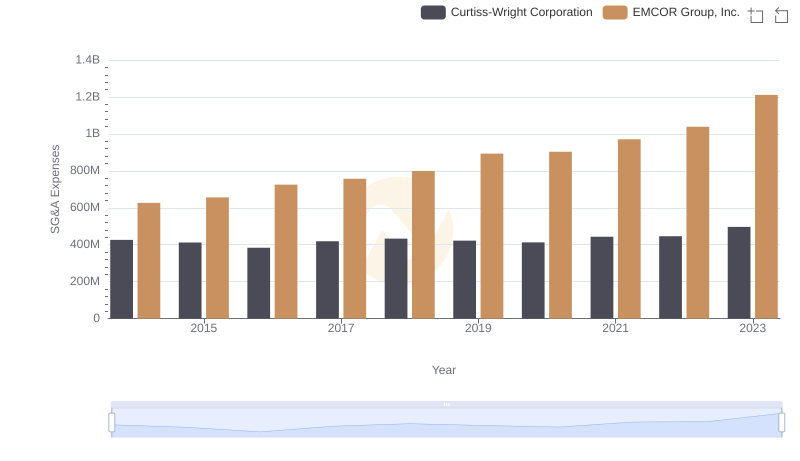
EMCOR Group, Inc. vs Curtiss-Wright Corporation: SG&A Expense Trends
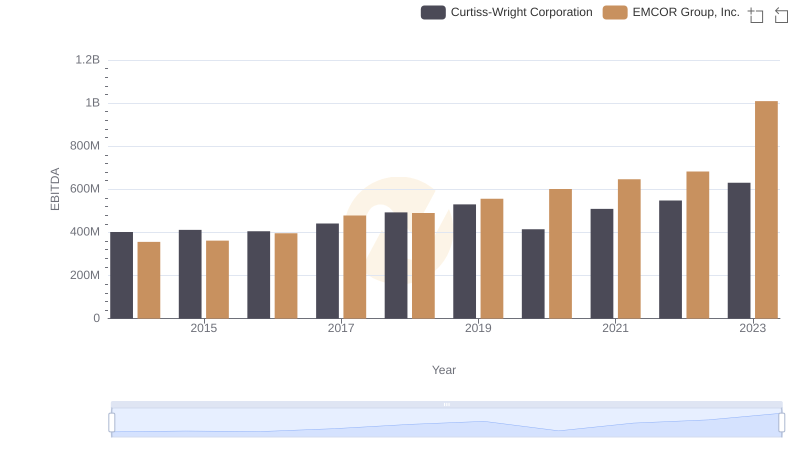
EBITDA Metrics Evaluated: EMCOR Group, Inc. vs Curtiss-Wright Corporation