| __timestamp | AECOM | EMCOR Group, Inc. |
|---|---|---|
| Wednesday, January 1, 2014 | 4855627000 | 6424965000 |
| Thursday, January 1, 2015 | 17989880000 | 6718726000 |
| Friday, January 1, 2016 | 17410825000 | 7551524000 |
| Sunday, January 1, 2017 | 18203402000 | 7686999000 |
| Monday, January 1, 2018 | 20155512000 | 8130631000 |
| Tuesday, January 1, 2019 | 20173329000 | 9174611000 |
| Wednesday, January 1, 2020 | 13239976000 | 8797061000 |
| Friday, January 1, 2021 | 13340852000 | 9903580000 |
| Saturday, January 1, 2022 | 13148182000 | 11076120000 |
| Sunday, January 1, 2023 | 14378461000 | 12582873000 |
| Monday, January 1, 2024 | 16105498000 |
Igniting the spark of knowledge
In the competitive landscape of engineering and construction, AECOM and EMCOR Group, Inc. have showcased distinct revenue trajectories over the past decade. From 2014 to 2023, AECOM's revenue surged by approximately 196%, peaking in 2018 and 2019. However, a dip in 2020 saw revenues drop by 34% from the previous year, reflecting industry-wide challenges. Meanwhile, EMCOR Group, Inc. demonstrated a steady growth pattern, with a notable 96% increase in revenue from 2014 to 2023. The year 2023 marked a significant milestone for EMCOR, achieving its highest revenue, while AECOM's data for 2024 remains unavailable. This comparison highlights the resilience and adaptability of these industry giants amidst fluctuating market conditions. As the construction sector evolves, these insights provide a glimpse into the strategic maneuvers that define success.
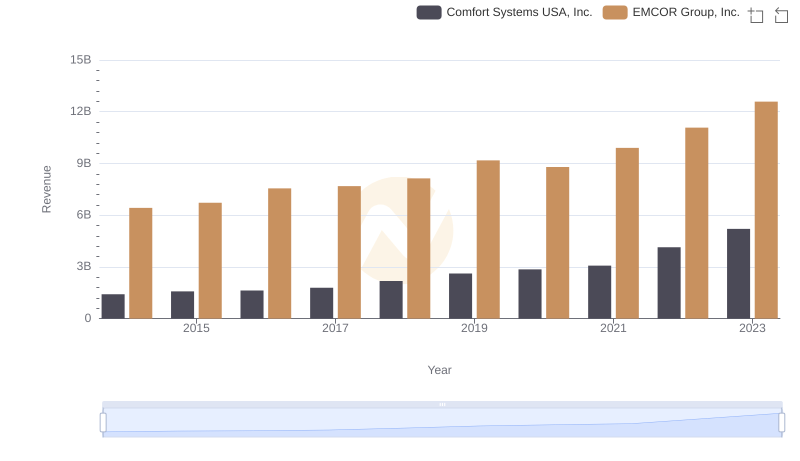
EMCOR Group, Inc. vs Comfort Systems USA, Inc.: Examining Key Revenue Metrics
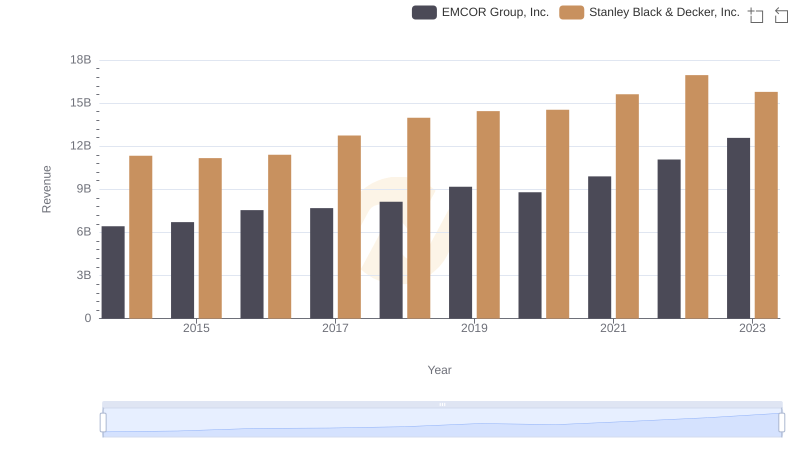
EMCOR Group, Inc. or Stanley Black & Decker, Inc.: Who Leads in Yearly Revenue?
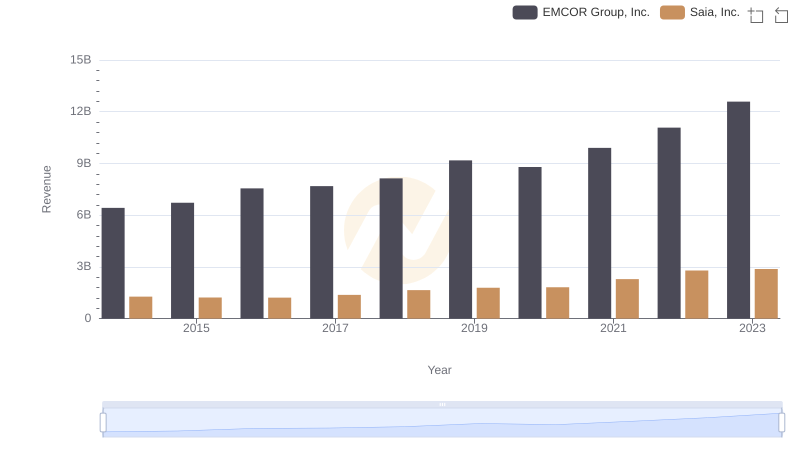
EMCOR Group, Inc. or Saia, Inc.: Who Leads in Yearly Revenue?
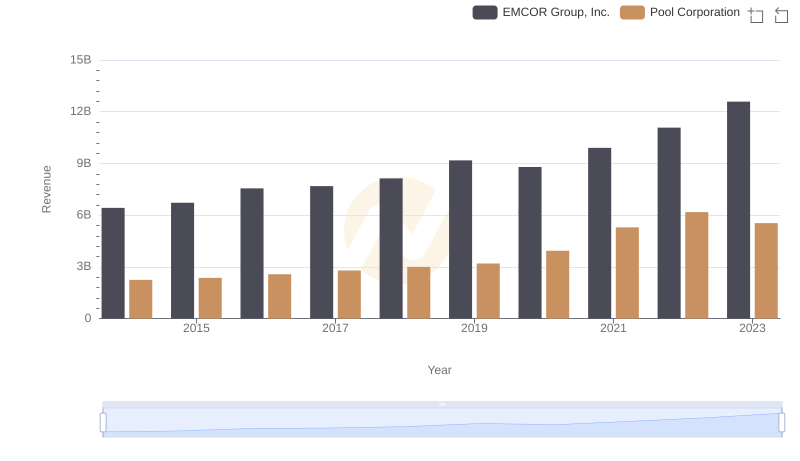
Annual Revenue Comparison: EMCOR Group, Inc. vs Pool Corporation
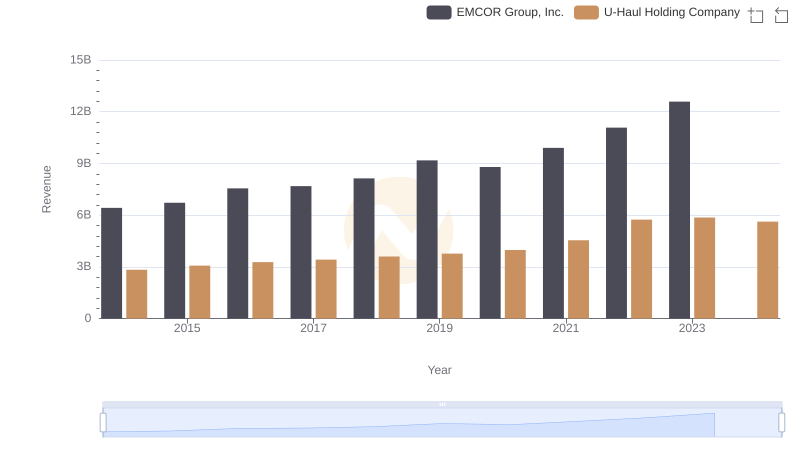
Comparing Revenue Performance: EMCOR Group, Inc. or U-Haul Holding Company?
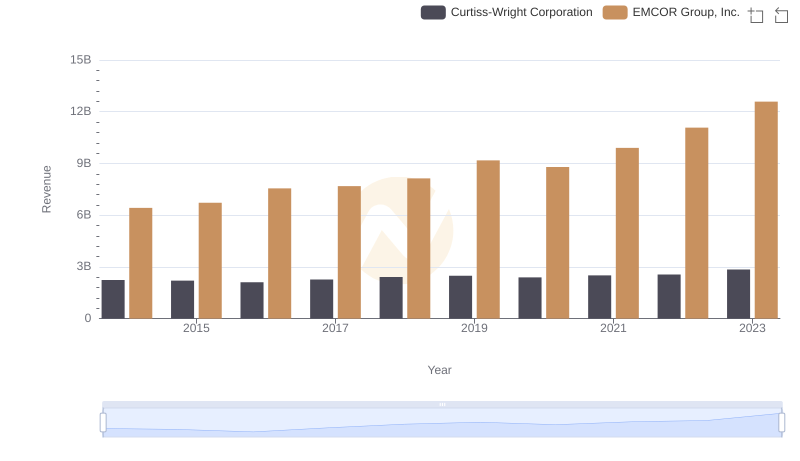
Comparing Revenue Performance: EMCOR Group, Inc. or Curtiss-Wright Corporation?
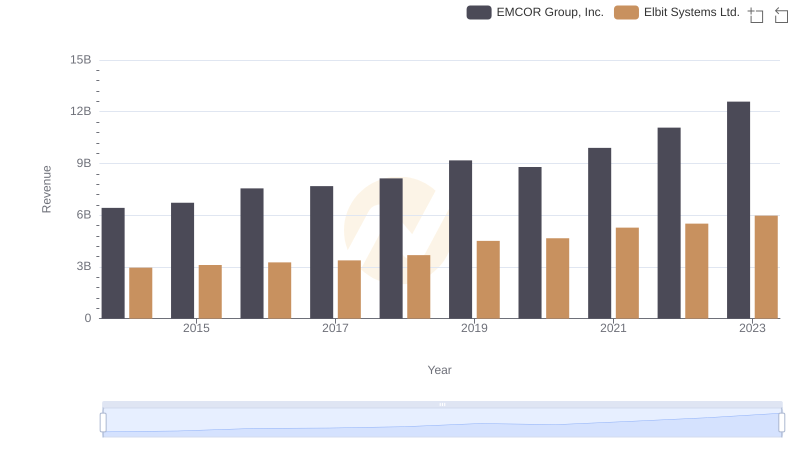
Comparing Revenue Performance: EMCOR Group, Inc. or Elbit Systems Ltd.?
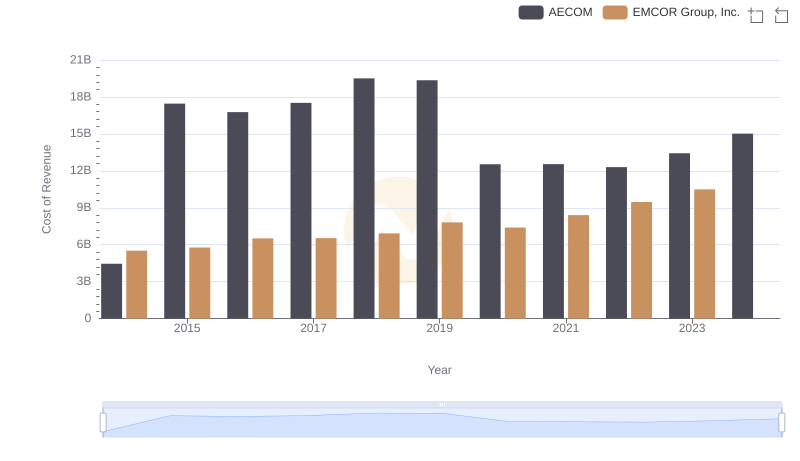
Cost of Revenue Trends: EMCOR Group, Inc. vs AECOM
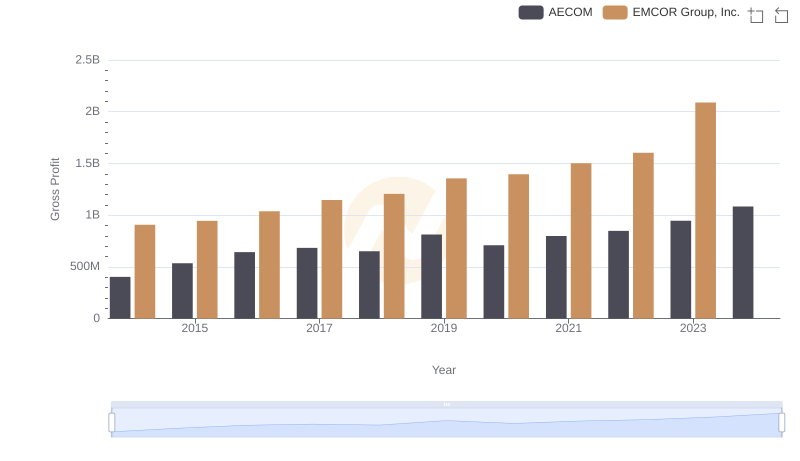
Who Generates Higher Gross Profit? EMCOR Group, Inc. or AECOM
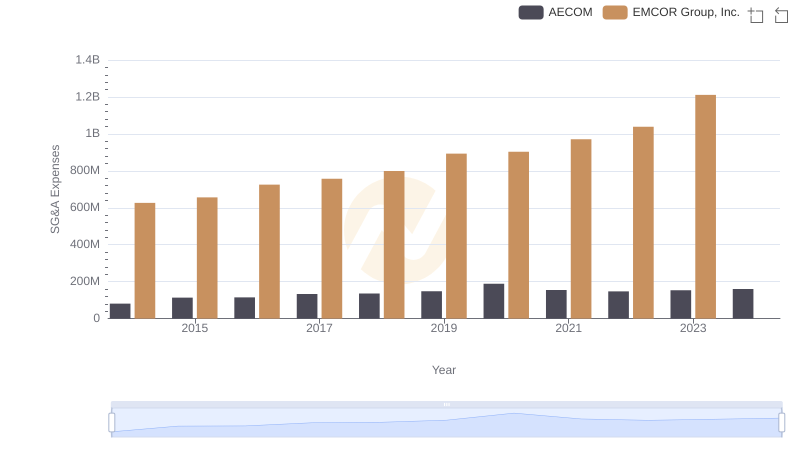
Comparing SG&A Expenses: EMCOR Group, Inc. vs AECOM Trends and Insights
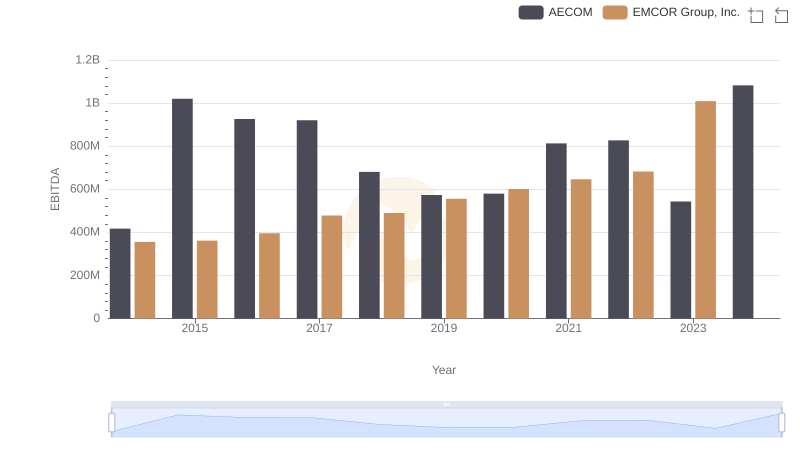
Comprehensive EBITDA Comparison: EMCOR Group, Inc. vs AECOM