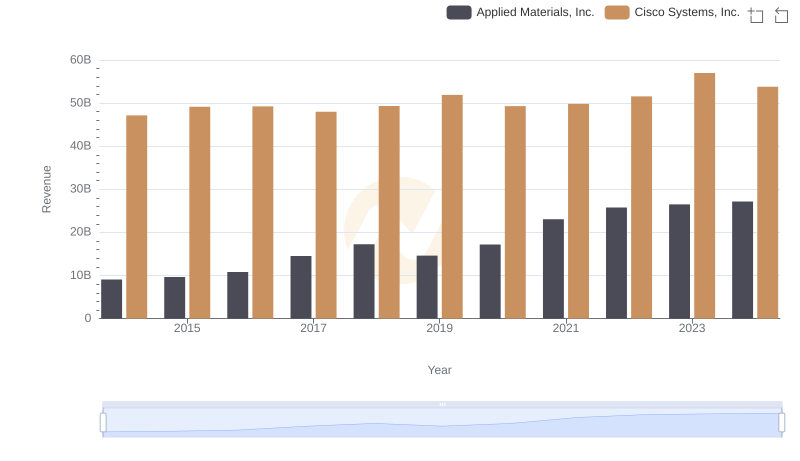
| __timestamp | Applied Materials, Inc. | Cisco Systems, Inc. |
|---|---|---|
| Wednesday, January 1, 2014 | 5229000000 | 19373000000 |
| Thursday, January 1, 2015 | 5707000000 | 19480000000 |
| Friday, January 1, 2016 | 6314000000 | 18287000000 |
| Sunday, January 1, 2017 | 8005000000 | 17781000000 |
| Monday, January 1, 2018 | 9436000000 | 18724000000 |
| Tuesday, January 1, 2019 | 8222000000 | 19238000000 |
| Wednesday, January 1, 2020 | 9510000000 | 17618000000 |
| Friday, January 1, 2021 | 12149000000 | 17924000000 |
| Saturday, January 1, 2022 | 13792000000 | 19309000000 |
| Sunday, January 1, 2023 | 14133000000 | 21245000000 |
| Monday, January 1, 2024 | 14279000000 | 18975000000 |
Data in motion
In the ever-evolving landscape of technology, Cisco Systems, Inc. and Applied Materials, Inc. have been pivotal players. Over the past decade, from 2014 to 2024, these industry titans have showcased distinct trajectories in their cost of revenue. Cisco, a leader in networking hardware, has maintained a relatively stable cost of revenue, peaking in 2023 with a 10% increase from its 2014 figures. Meanwhile, Applied Materials, a key player in semiconductor manufacturing, has seen a dramatic rise, with costs nearly tripling by 2024. This surge reflects the growing demand for semiconductors in a tech-driven world. The data highlights a fascinating divergence: while Cisco's costs reflect steady growth, Applied Materials' costs underscore the explosive expansion in semiconductor needs. As we look to the future, these trends offer a glimpse into the strategic priorities and market dynamics shaping these giants.
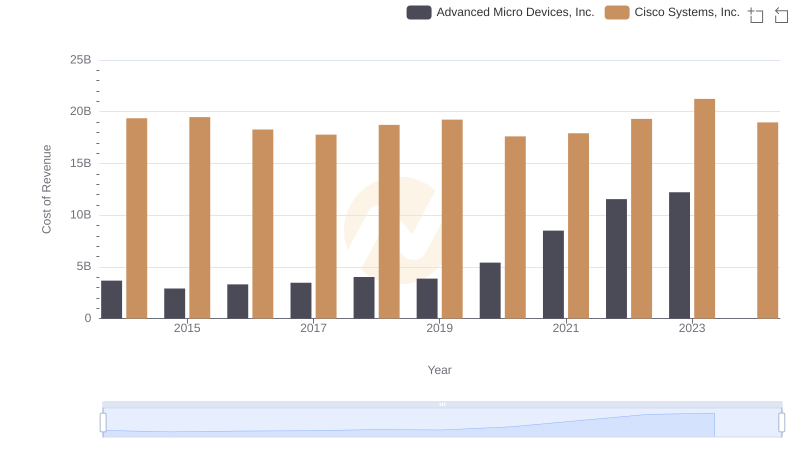
Cost of Revenue Trends: Cisco Systems, Inc. vs Advanced Micro Devices, Inc.
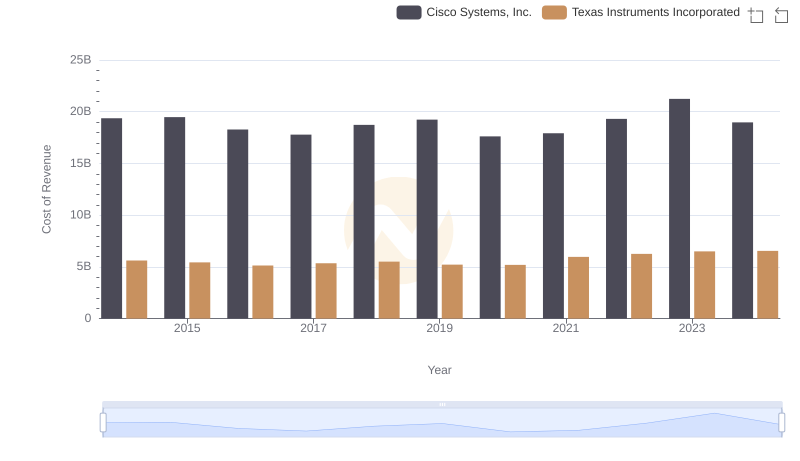
Cost of Revenue Trends: Cisco Systems, Inc. vs Texas Instruments Incorporated
Cisco Systems, Inc. vs Applied Materials, Inc.: Annual Revenue Growth Compared
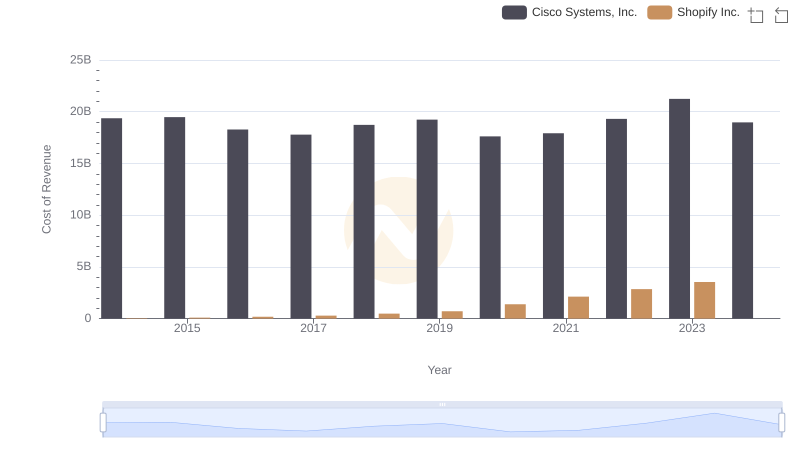
Cost of Revenue Comparison: Cisco Systems, Inc. vs Shopify Inc.
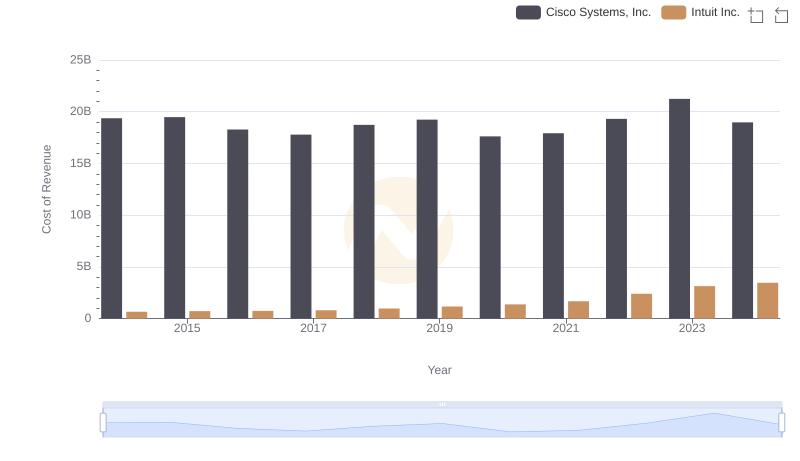
Cost of Revenue: Key Insights for Cisco Systems, Inc. and Intuit Inc.
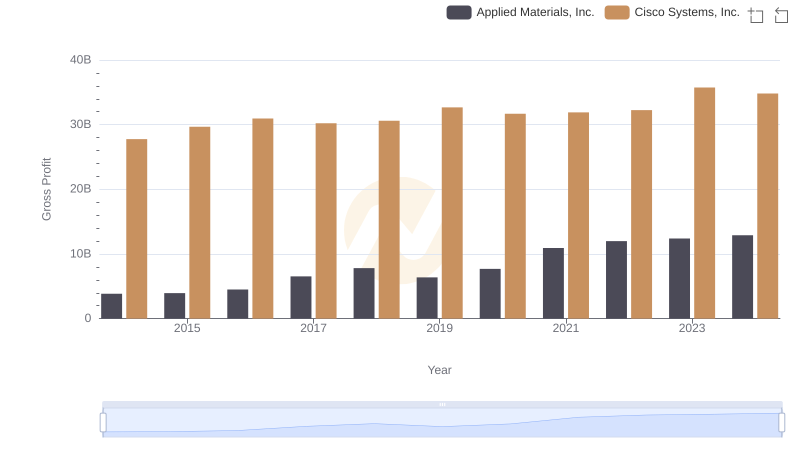
Gross Profit Analysis: Comparing Cisco Systems, Inc. and Applied Materials, Inc.
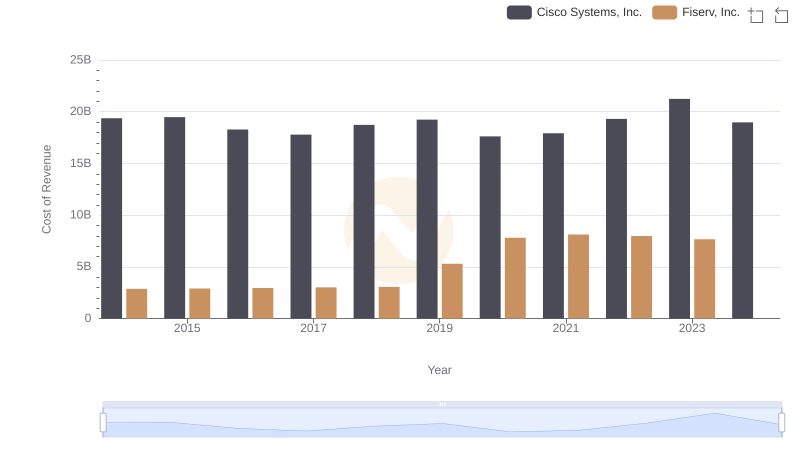
Analyzing Cost of Revenue: Cisco Systems, Inc. and Fiserv, Inc.
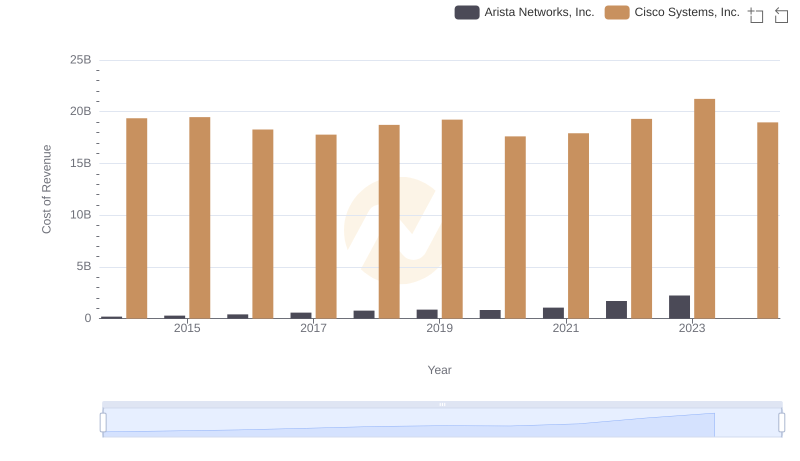
Analyzing Cost of Revenue: Cisco Systems, Inc. and Arista Networks, Inc.
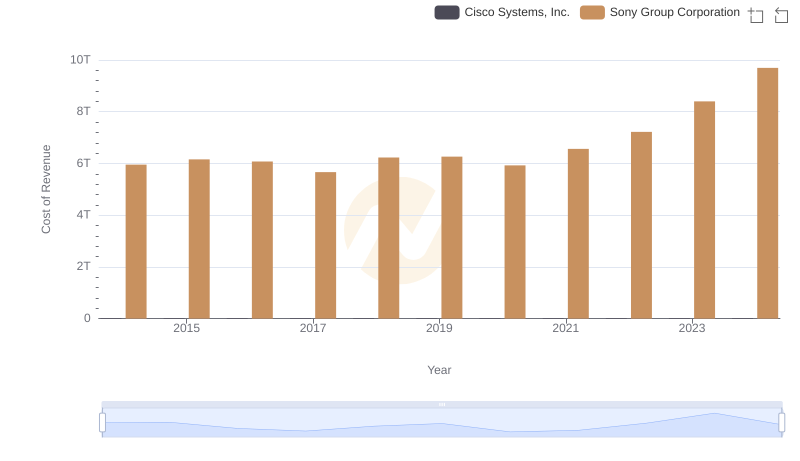
Cisco Systems, Inc. vs Sony Group Corporation: Efficiency in Cost of Revenue Explored
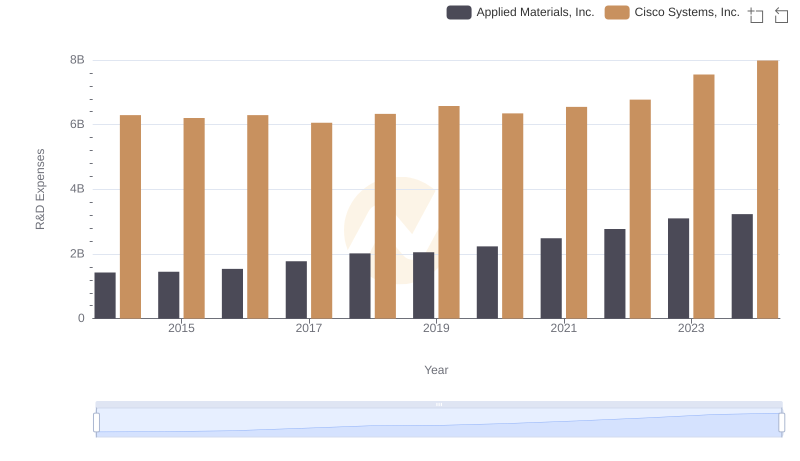
Cisco Systems, Inc. or Applied Materials, Inc.: Who Invests More in Innovation?
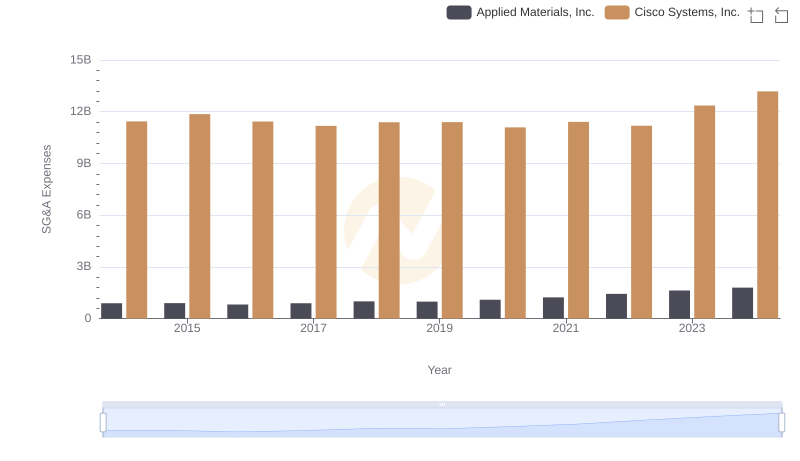
Operational Costs Compared: SG&A Analysis of Cisco Systems, Inc. and Applied Materials, Inc.
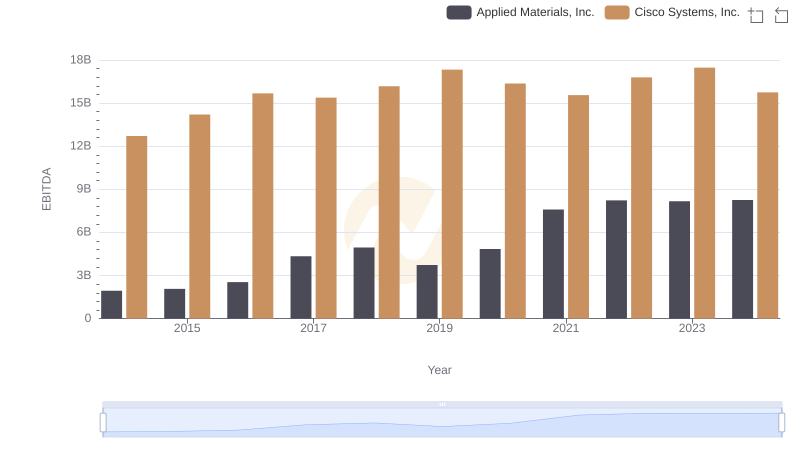
EBITDA Performance Review: Cisco Systems, Inc. vs Applied Materials, Inc.