| __timestamp | Advanced Micro Devices, Inc. | Cisco Systems, Inc. |
|---|---|---|
| Wednesday, January 1, 2014 | 3667000000 | 19373000000 |
| Thursday, January 1, 2015 | 2911000000 | 19480000000 |
| Friday, January 1, 2016 | 3316000000 | 18287000000 |
| Sunday, January 1, 2017 | 3466000000 | 17781000000 |
| Monday, January 1, 2018 | 4028000000 | 18724000000 |
| Tuesday, January 1, 2019 | 3863000000 | 19238000000 |
| Wednesday, January 1, 2020 | 5416000000 | 17618000000 |
| Friday, January 1, 2021 | 8505000000 | 17924000000 |
| Saturday, January 1, 2022 | 11550000000 | 19309000000 |
| Sunday, January 1, 2023 | 12220000000 | 21245000000 |
| Monday, January 1, 2024 | 13060000000 | 18975000000 |
Data in motion
In the ever-evolving landscape of technology, Cisco Systems, Inc. and Advanced Micro Devices, Inc. (AMD) have carved distinct paths. From 2014 to 2023, Cisco's cost of revenue has shown remarkable stability, fluctuating within a narrow band, peaking at approximately 21.2 billion in 2023. This reflects Cisco's consistent operational efficiency and market dominance in networking solutions.
Conversely, AMD's cost of revenue has surged by over 230% during the same period, from around 3.7 billion in 2014 to 12.2 billion in 2023. This dramatic rise underscores AMD's aggressive expansion and innovation in the semiconductor industry, capturing significant market share.
While Cisco's steady trajectory highlights its established market position, AMD's rapid growth trajectory signals its rising influence. The absence of data for AMD in 2024 suggests a potential shift or anomaly, inviting further exploration into future trends.
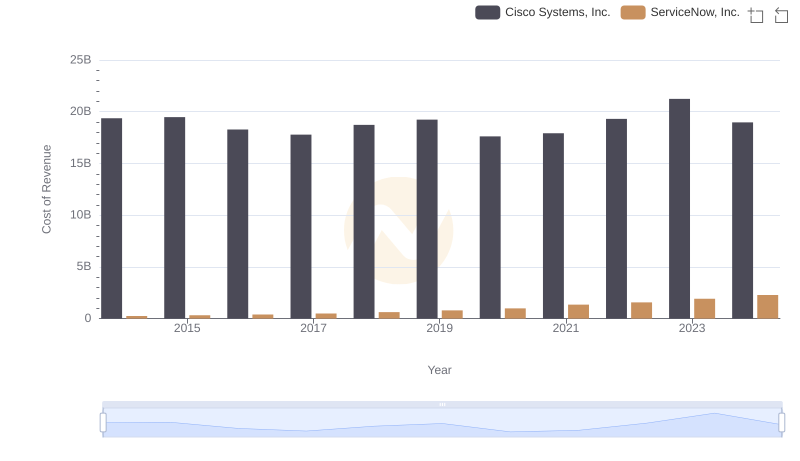
Analyzing Cost of Revenue: Cisco Systems, Inc. and ServiceNow, Inc.
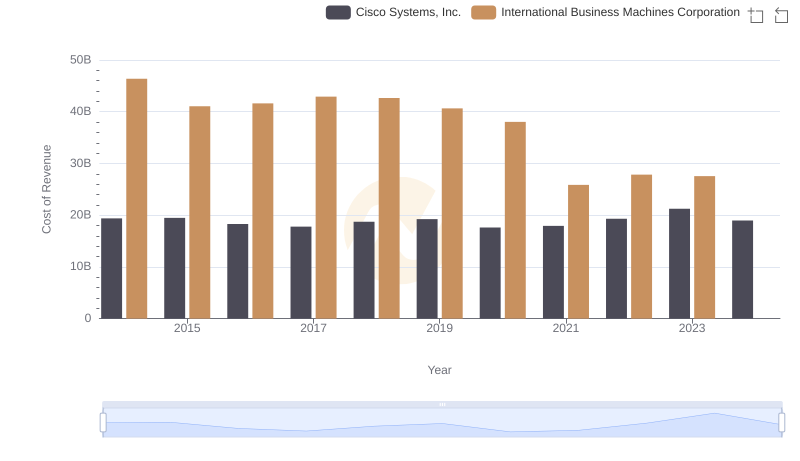
Cost Insights: Breaking Down Cisco Systems, Inc. and International Business Machines Corporation's Expenses
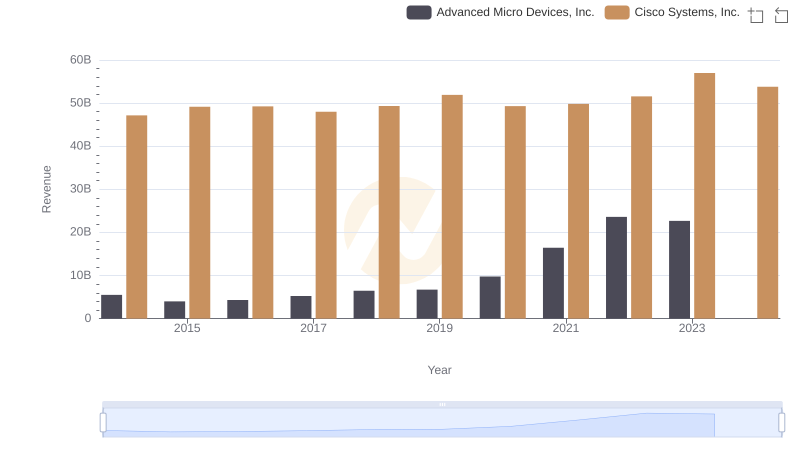
Cisco Systems, Inc. or Advanced Micro Devices, Inc.: Who Leads in Yearly Revenue?
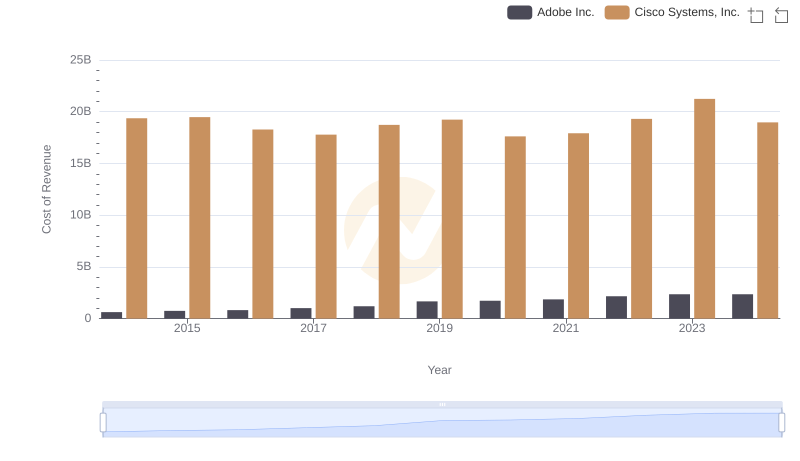
Comparing Cost of Revenue Efficiency: Cisco Systems, Inc. vs Adobe Inc.
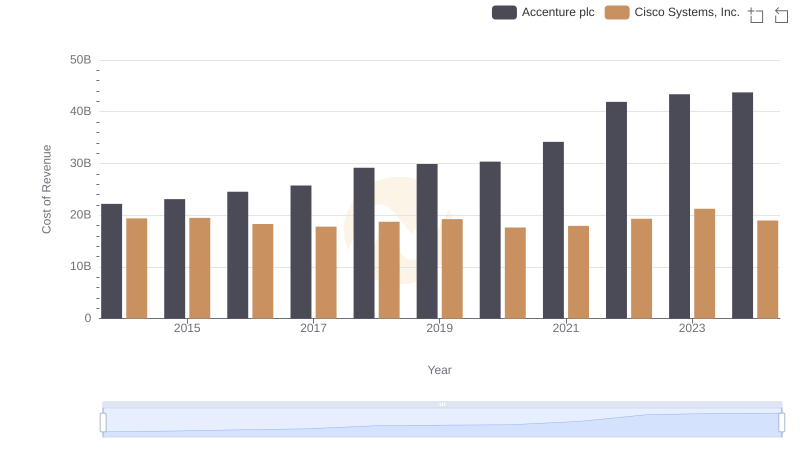
Analyzing Cost of Revenue: Cisco Systems, Inc. and Accenture plc
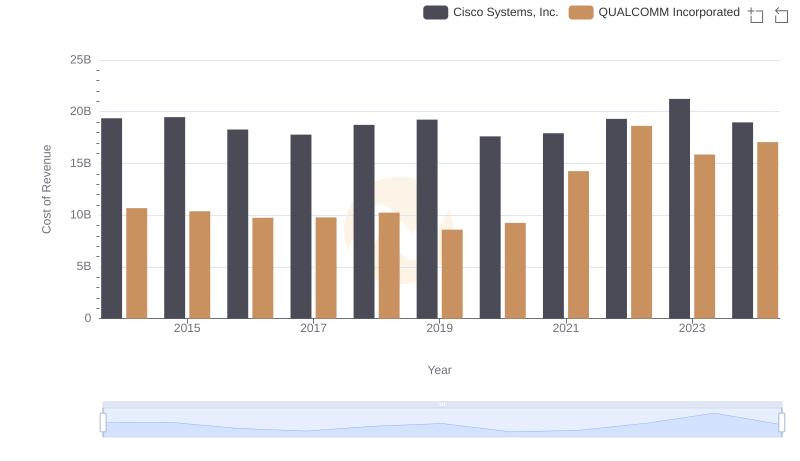
Cost of Revenue Comparison: Cisco Systems, Inc. vs QUALCOMM Incorporated
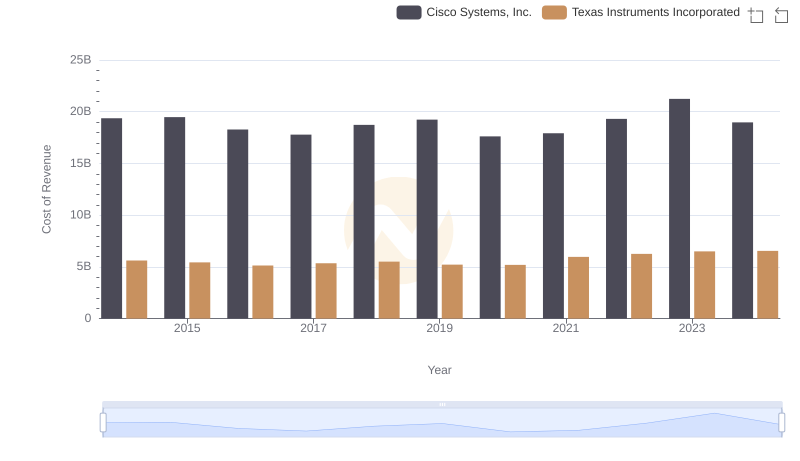
Cost of Revenue Trends: Cisco Systems, Inc. vs Texas Instruments Incorporated
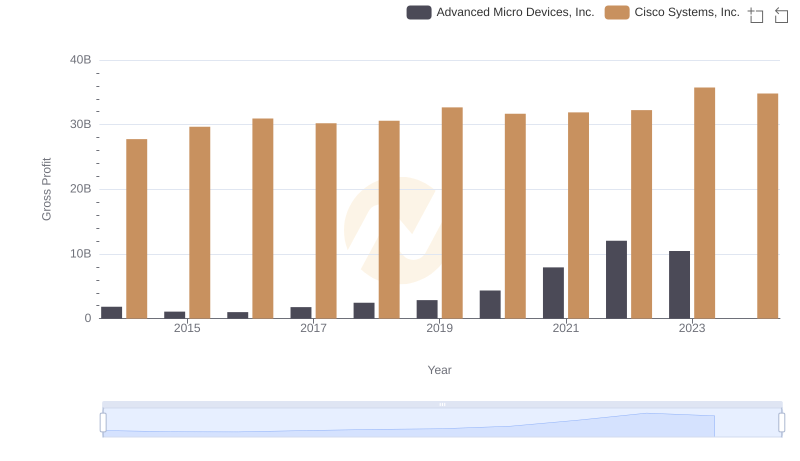
Cisco Systems, Inc. and Advanced Micro Devices, Inc.: A Detailed Gross Profit Analysis
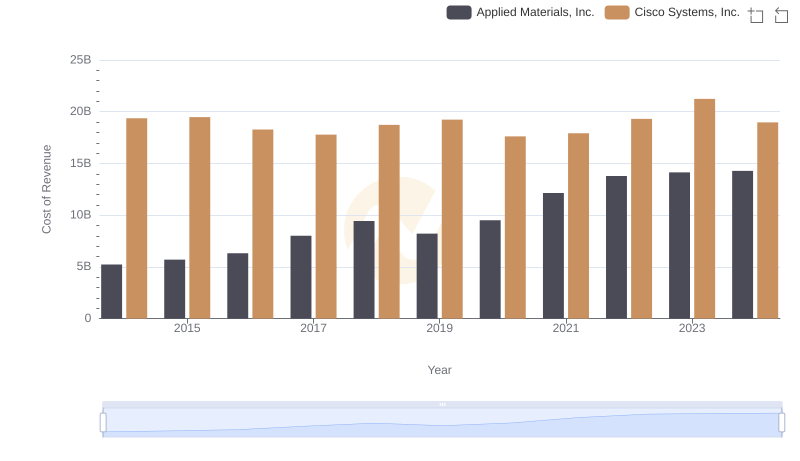
Cost of Revenue Trends: Cisco Systems, Inc. vs Applied Materials, Inc.
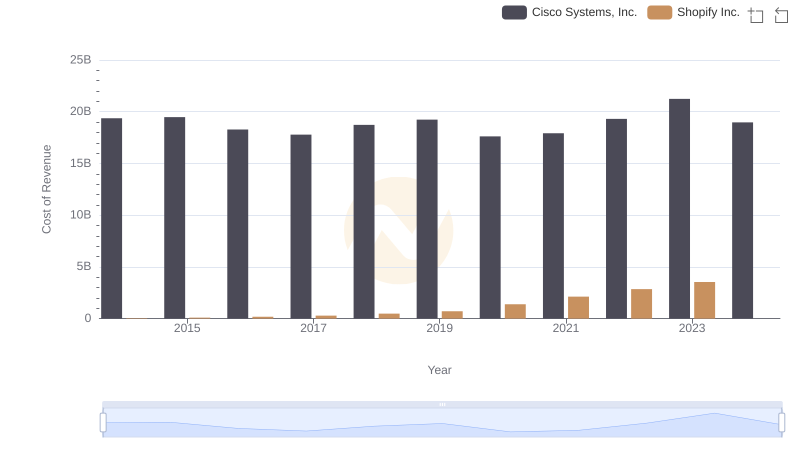
Cost of Revenue Comparison: Cisco Systems, Inc. vs Shopify Inc.
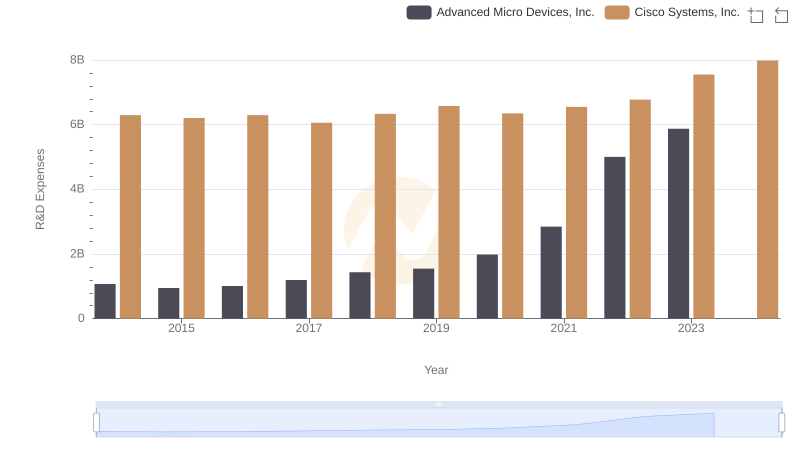
Who Prioritizes Innovation? R&D Spending Compared for Cisco Systems, Inc. and Advanced Micro Devices, Inc.
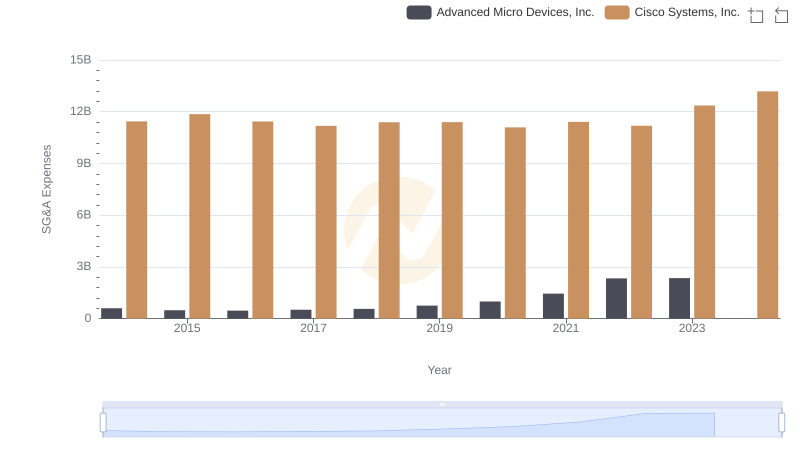
SG&A Efficiency Analysis: Comparing Cisco Systems, Inc. and Advanced Micro Devices, Inc.