| __timestamp | Cisco Systems, Inc. | Fiserv, Inc. |
|---|---|---|
| Wednesday, January 1, 2014 | 19373000000 | 2881000000 |
| Thursday, January 1, 2015 | 19480000000 | 2909000000 |
| Friday, January 1, 2016 | 18287000000 | 2959000000 |
| Sunday, January 1, 2017 | 17781000000 | 3024000000 |
| Monday, January 1, 2018 | 18724000000 | 3069000000 |
| Tuesday, January 1, 2019 | 19238000000 | 5309000000 |
| Wednesday, January 1, 2020 | 17618000000 | 7812000000 |
| Friday, January 1, 2021 | 17924000000 | 8128000000 |
| Saturday, January 1, 2022 | 19309000000 | 7992000000 |
| Sunday, January 1, 2023 | 21245000000 | 7670000000 |
| Monday, January 1, 2024 | 18975000000 | 0 |
Unleashing insights
In the ever-evolving landscape of technology and financial services, understanding cost structures is crucial. Cisco Systems, Inc., a leader in networking technology, and Fiserv, Inc., a prominent player in financial services technology, offer intriguing insights into cost management over the past decade. From 2014 to 2023, Cisco's cost of revenue fluctuated, peaking in 2023 with a 10% increase from 2014. Meanwhile, Fiserv's cost of revenue saw a dramatic rise, more than doubling by 2021, reflecting its aggressive expansion and adaptation to market demands. However, data for 2024 is missing, leaving room for speculation on future trends. This analysis not only highlights the strategic financial maneuvers of these giants but also underscores the dynamic nature of their respective industries. As we look to the future, these trends will be pivotal in shaping their competitive edge and market positioning.
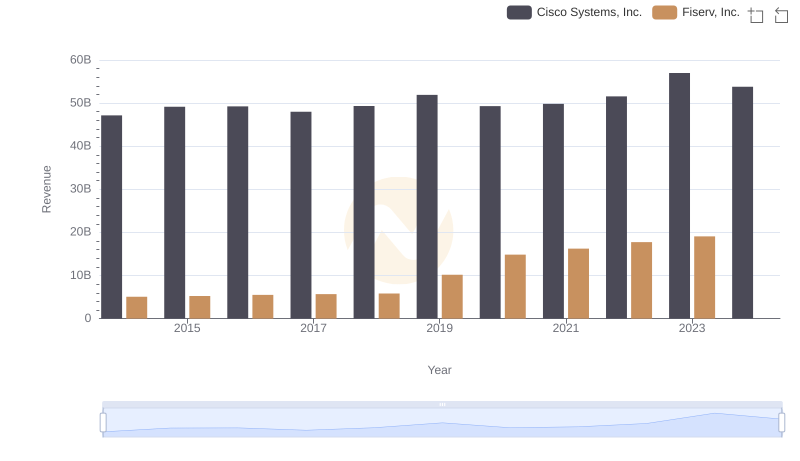
Comparing Revenue Performance: Cisco Systems, Inc. or Fiserv, Inc.?

Revenue Insights: Cisco Systems, Inc. and Fiserv, Inc. Performance Compared
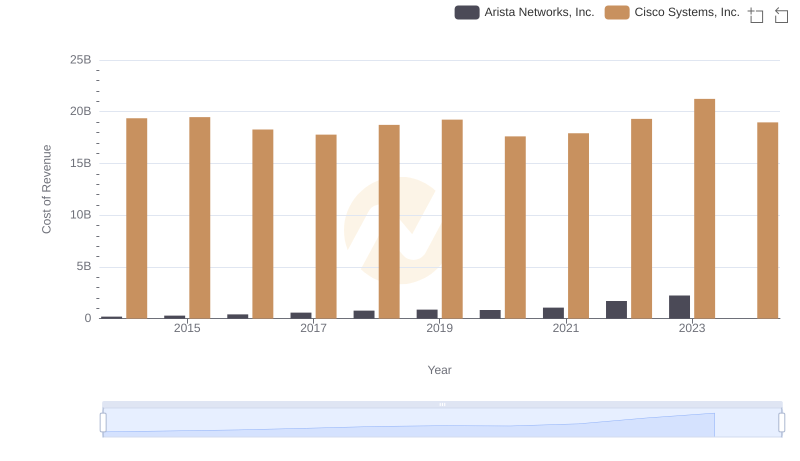
Analyzing Cost of Revenue: Cisco Systems, Inc. and Arista Networks, Inc.
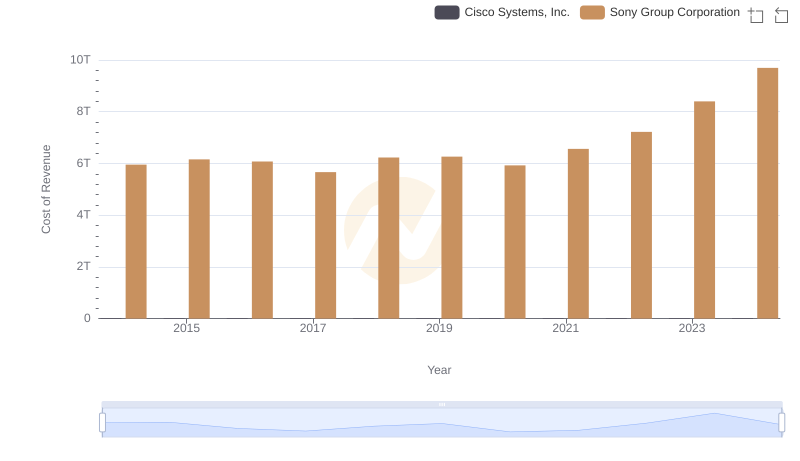
Cisco Systems, Inc. vs Sony Group Corporation: Efficiency in Cost of Revenue Explored

Cost of Revenue Trends: Cisco Systems, Inc. vs Palo Alto Networks, Inc.
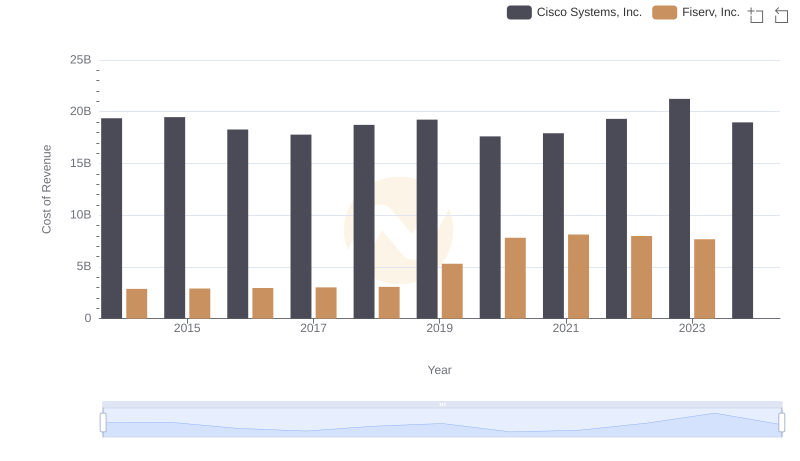
Cost of Revenue Comparison: Cisco Systems, Inc. vs Fiserv, Inc.

Key Insights on Gross Profit: Cisco Systems, Inc. vs Fiserv, Inc.
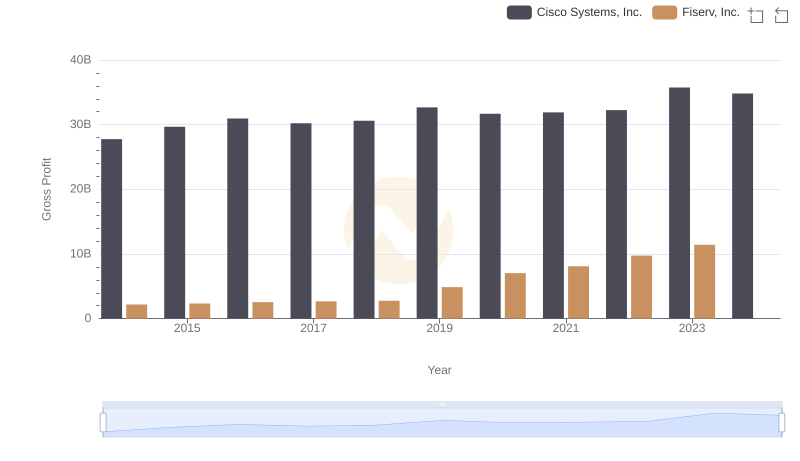
Key Insights on Gross Profit: Cisco Systems, Inc. vs Fiserv, Inc.
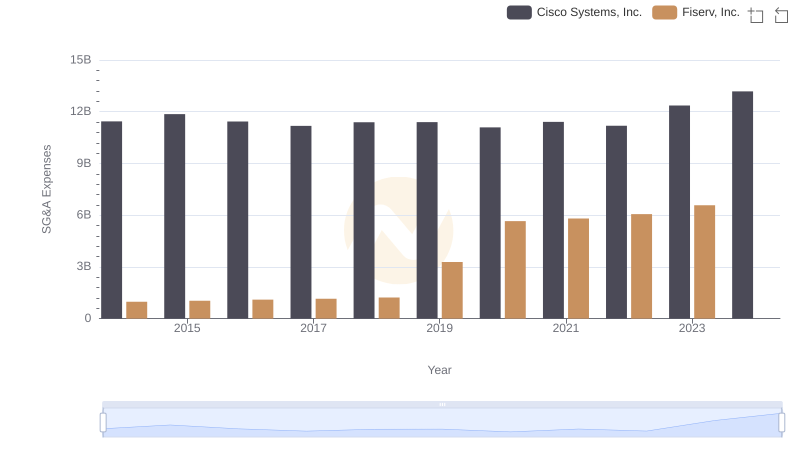
SG&A Efficiency Analysis: Comparing Cisco Systems, Inc. and Fiserv, Inc.
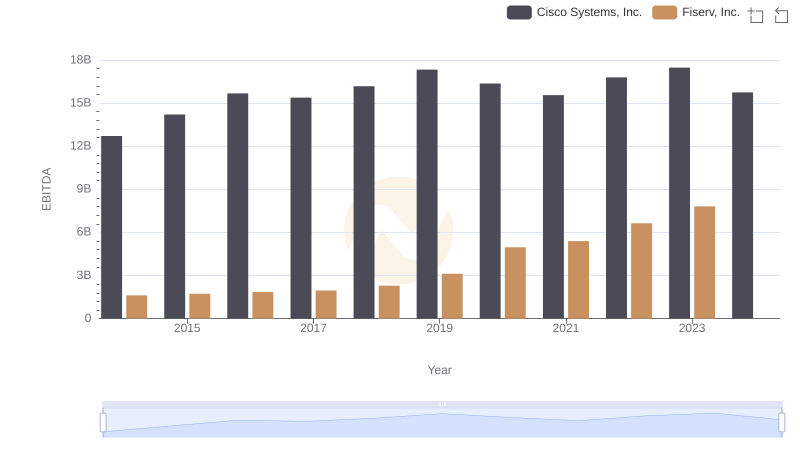
EBITDA Analysis: Evaluating Cisco Systems, Inc. Against Fiserv, Inc.

Comparing SG&A Expenses: Cisco Systems, Inc. vs Fiserv, Inc. Trends and Insights

A Professional Review of EBITDA: Cisco Systems, Inc. Compared to Fiserv, Inc.