| __timestamp | Cisco Systems, Inc. | Intuit Inc. |
|---|---|---|
| Wednesday, January 1, 2014 | 19373000000 | 668000000 |
| Thursday, January 1, 2015 | 19480000000 | 725000000 |
| Friday, January 1, 2016 | 18287000000 | 752000000 |
| Sunday, January 1, 2017 | 17781000000 | 809000000 |
| Monday, January 1, 2018 | 18724000000 | 977000000 |
| Tuesday, January 1, 2019 | 19238000000 | 1167000000 |
| Wednesday, January 1, 2020 | 17618000000 | 1378000000 |
| Friday, January 1, 2021 | 17924000000 | 1683000000 |
| Saturday, January 1, 2022 | 19309000000 | 2406000000 |
| Sunday, January 1, 2023 | 21245000000 | 3143000000 |
| Monday, January 1, 2024 | 18975000000 | 3465000000 |
Cracking the code
In the ever-evolving landscape of technology, understanding the cost of revenue is crucial for assessing a company's financial health. Over the past decade, Cisco Systems, Inc. and Intuit Inc. have shown distinct trends in their cost of revenue, reflecting their strategic priorities and market dynamics.
From 2014 to 2024, Cisco's cost of revenue has fluctuated, peaking in 2023 with a 10% increase from 2014. This suggests a strategic investment in maintaining its market leadership. In contrast, Intuit Inc. has experienced a dramatic rise, with its cost of revenue surging by over 400% during the same period, highlighting its aggressive expansion and innovation in financial software solutions.
These insights provide a window into how these tech giants are navigating the competitive landscape, balancing growth with operational efficiency.
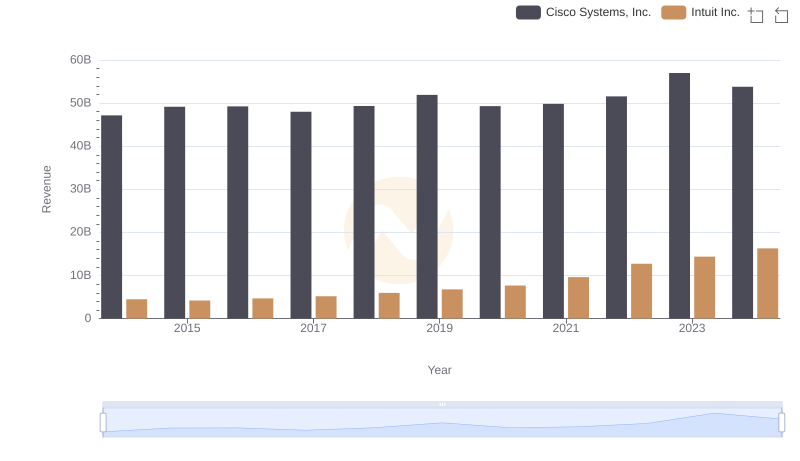
Revenue Showdown: Cisco Systems, Inc. vs Intuit Inc.
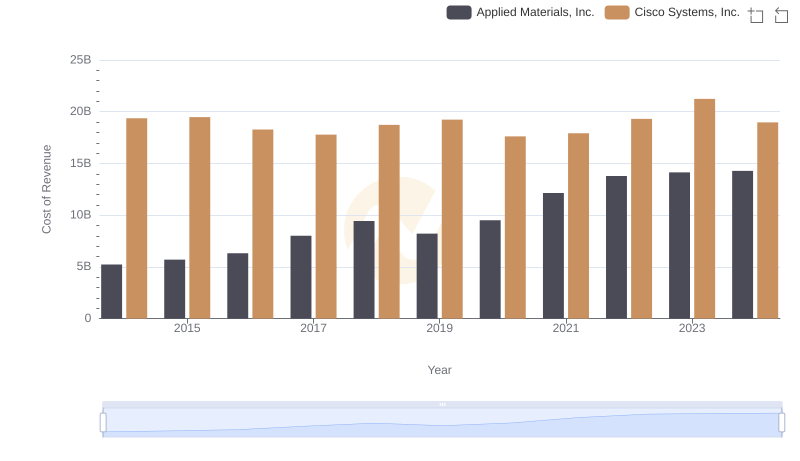
Cost of Revenue Trends: Cisco Systems, Inc. vs Applied Materials, Inc.
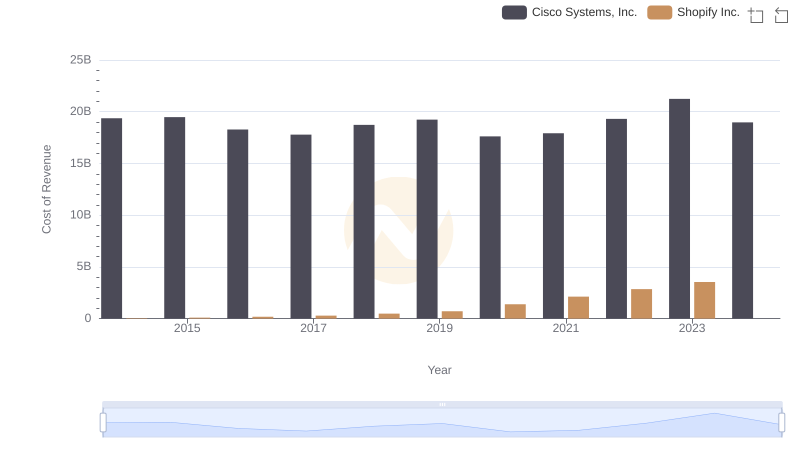
Cost of Revenue Comparison: Cisco Systems, Inc. vs Shopify Inc.
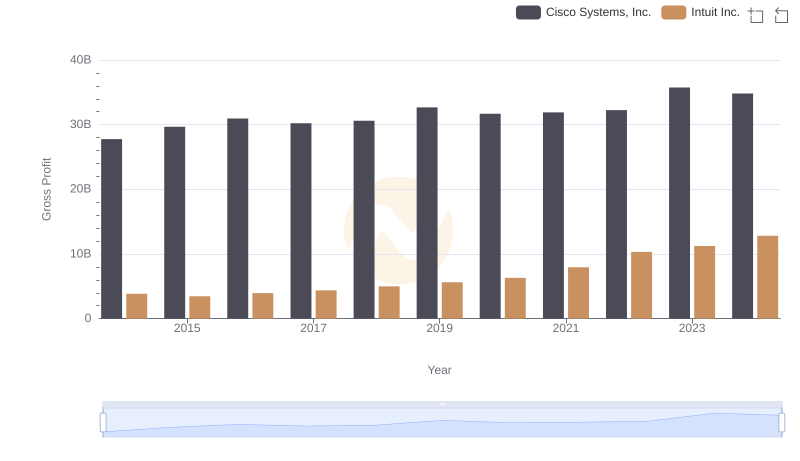
Who Generates Higher Gross Profit? Cisco Systems, Inc. or Intuit Inc.

Analyzing Cost of Revenue: Cisco Systems, Inc. and Fiserv, Inc.
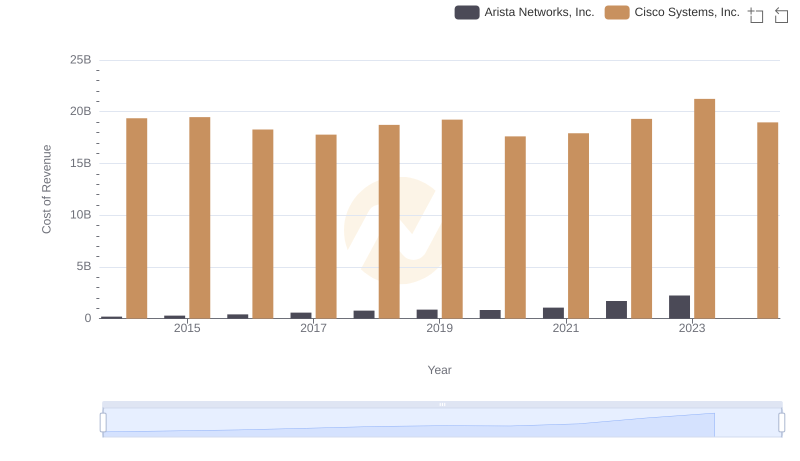
Analyzing Cost of Revenue: Cisco Systems, Inc. and Arista Networks, Inc.
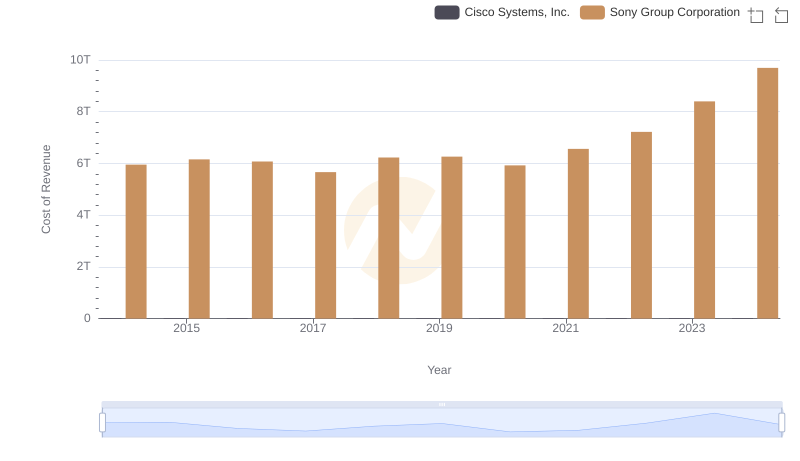
Cisco Systems, Inc. vs Sony Group Corporation: Efficiency in Cost of Revenue Explored

Cost of Revenue Trends: Cisco Systems, Inc. vs Palo Alto Networks, Inc.
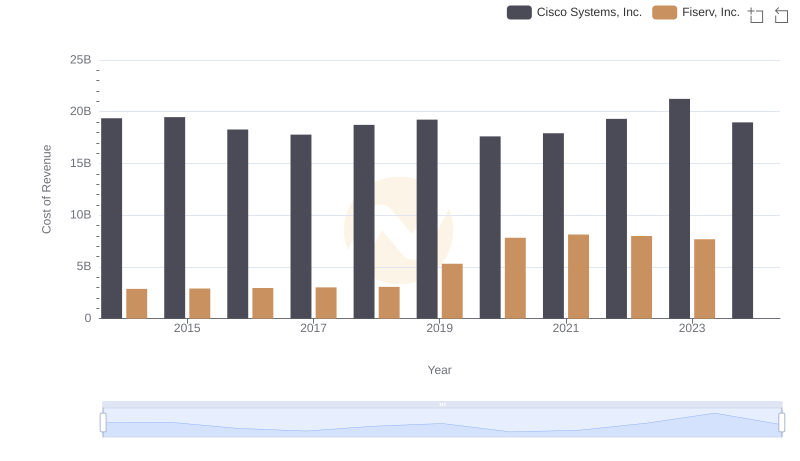
Cost of Revenue Comparison: Cisco Systems, Inc. vs Fiserv, Inc.
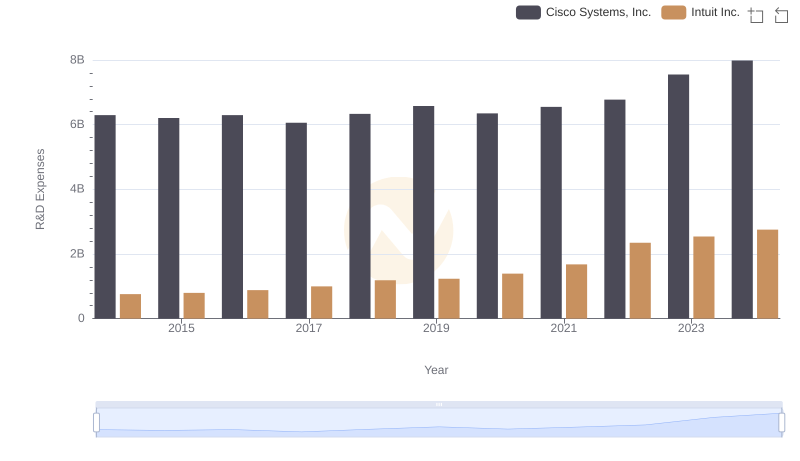
Cisco Systems, Inc. vs Intuit Inc.: Strategic Focus on R&D Spending
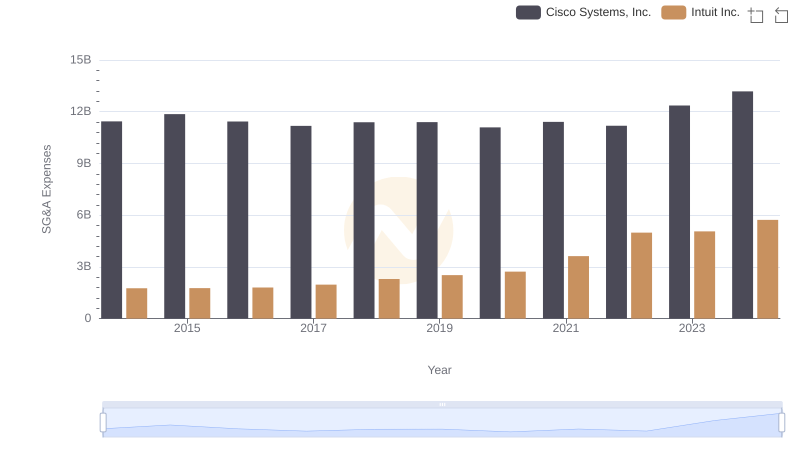
Cost Management Insights: SG&A Expenses for Cisco Systems, Inc. and Intuit Inc.
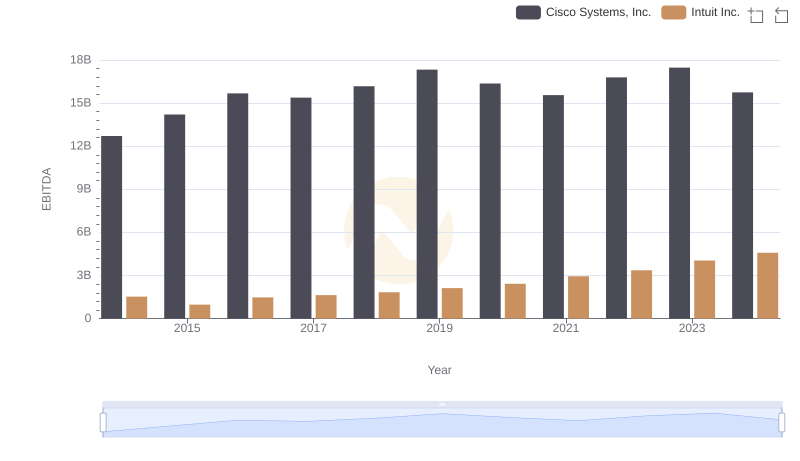
Cisco Systems, Inc. vs Intuit Inc.: In-Depth EBITDA Performance Comparison