| __timestamp | Applied Materials, Inc. | Cisco Systems, Inc. |
|---|---|---|
| Wednesday, January 1, 2014 | 1939000000 | 12709000000 |
| Thursday, January 1, 2015 | 2074000000 | 14209000000 |
| Friday, January 1, 2016 | 2539000000 | 15678000000 |
| Sunday, January 1, 2017 | 4343000000 | 15383000000 |
| Monday, January 1, 2018 | 4953000000 | 16172000000 |
| Tuesday, January 1, 2019 | 3735000000 | 17334000000 |
| Wednesday, January 1, 2020 | 4844000000 | 16363000000 |
| Friday, January 1, 2021 | 7594000000 | 15558000000 |
| Saturday, January 1, 2022 | 8228000000 | 16794000000 |
| Sunday, January 1, 2023 | 8169000000 | 17471000000 |
| Monday, January 1, 2024 | 8259000000 | 15747000000 |
Unveiling the hidden dimensions of data
In the ever-evolving tech landscape, Cisco Systems, Inc. and Applied Materials, Inc. have demonstrated remarkable EBITDA growth over the past decade. From 2014 to 2023, Cisco's EBITDA surged by approximately 37%, peaking in 2023. Meanwhile, Applied Materials experienced a staggering 323% increase, highlighting its dynamic growth trajectory.
Cisco's EBITDA consistently hovered around the $15 billion mark, with a notable peak in 2023. This stability underscores Cisco's robust market position and strategic adaptability in the face of industry shifts.
Applied Materials, on the other hand, showcased a more volatile yet impressive growth pattern. Starting at a modest $1.9 billion in 2014, it reached over $8 billion by 2023, reflecting its aggressive expansion and innovation strategies.
This comparative analysis offers a glimpse into the strategic maneuvers of two tech giants, each carving its path in the competitive tech arena.
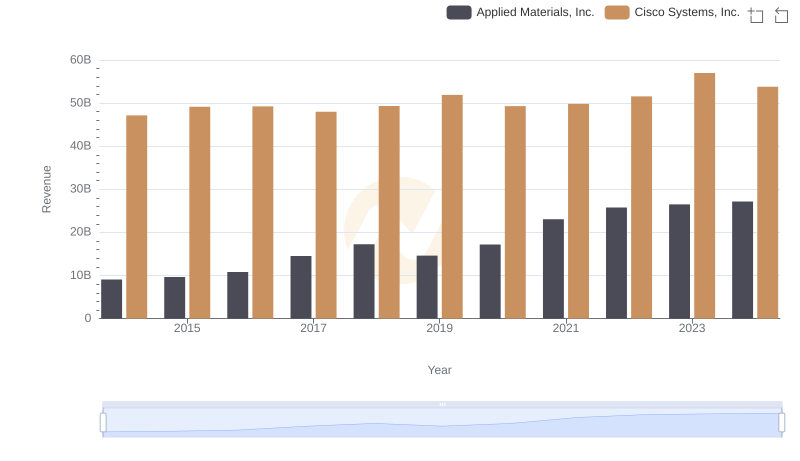
Cisco Systems, Inc. vs Applied Materials, Inc.: Annual Revenue Growth Compared
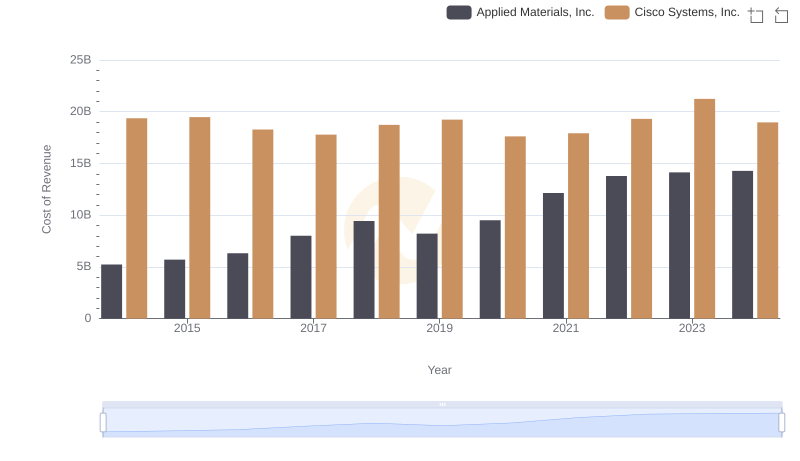
Cost of Revenue Trends: Cisco Systems, Inc. vs Applied Materials, Inc.
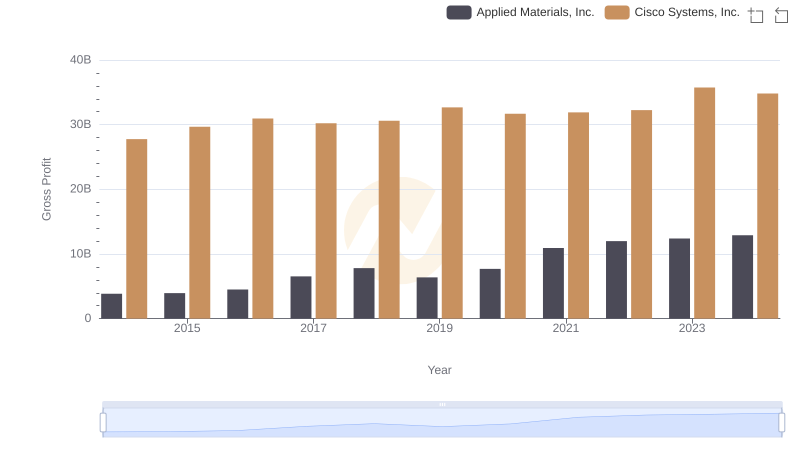
Gross Profit Analysis: Comparing Cisco Systems, Inc. and Applied Materials, Inc.
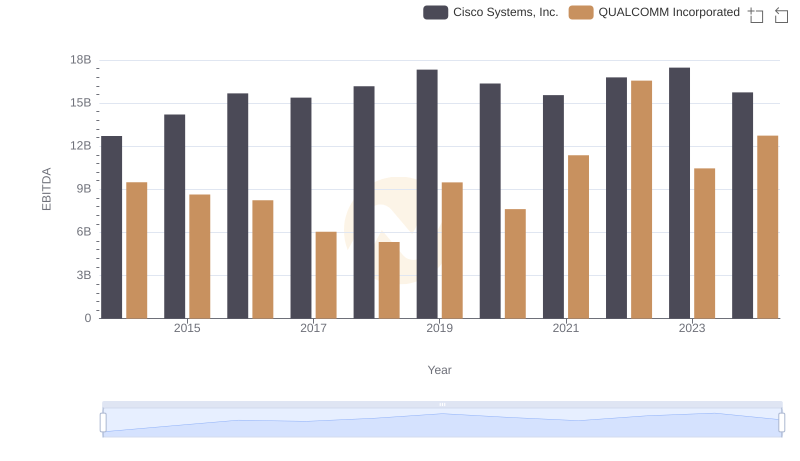
Cisco Systems, Inc. and QUALCOMM Incorporated: A Detailed Examination of EBITDA Performance
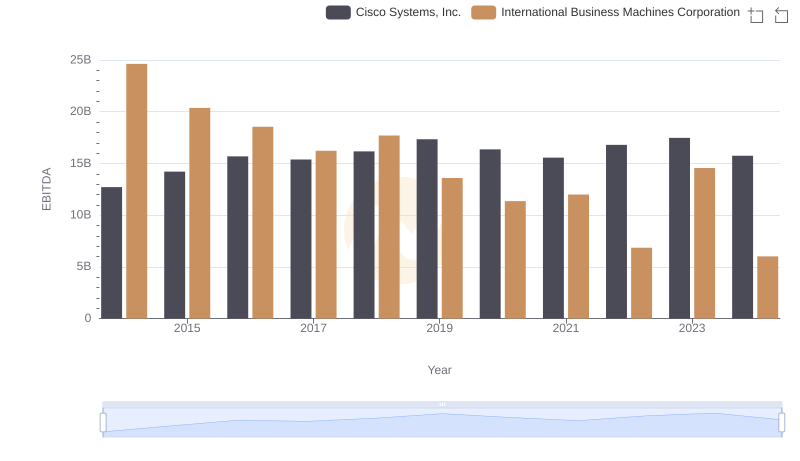
Cisco Systems, Inc. and International Business Machines Corporation: A Detailed Examination of EBITDA Performance
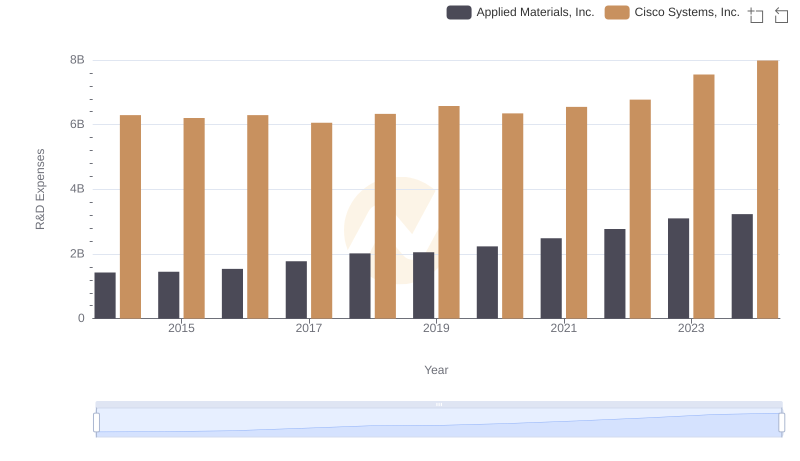
Cisco Systems, Inc. or Applied Materials, Inc.: Who Invests More in Innovation?
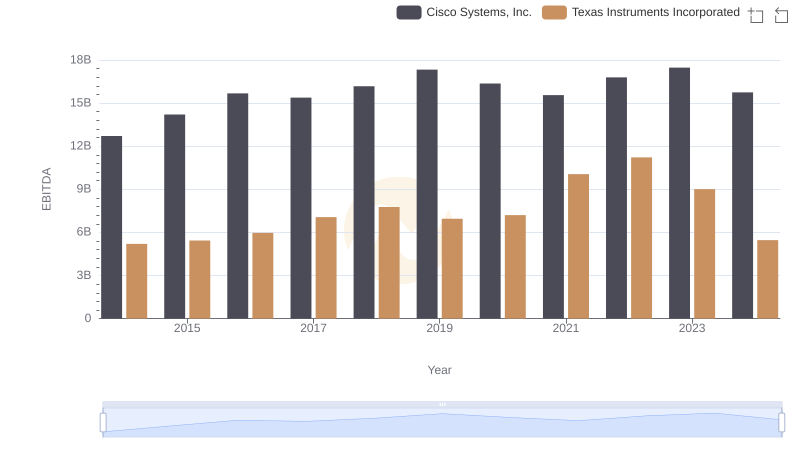
Cisco Systems, Inc. vs Texas Instruments Incorporated: In-Depth EBITDA Performance Comparison
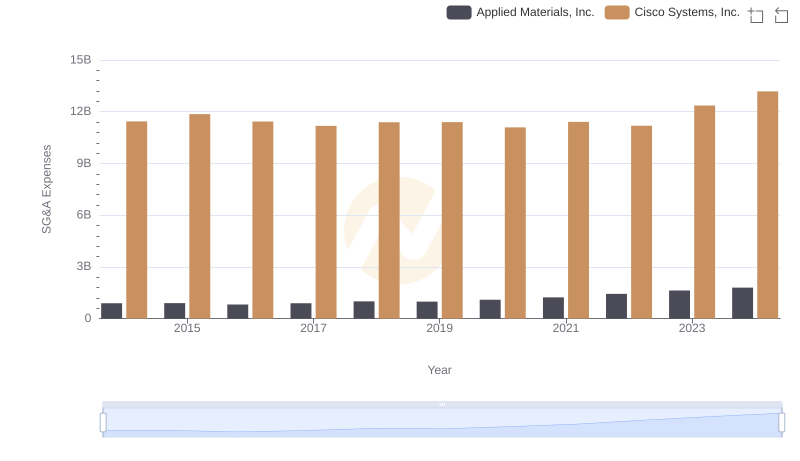
Operational Costs Compared: SG&A Analysis of Cisco Systems, Inc. and Applied Materials, Inc.
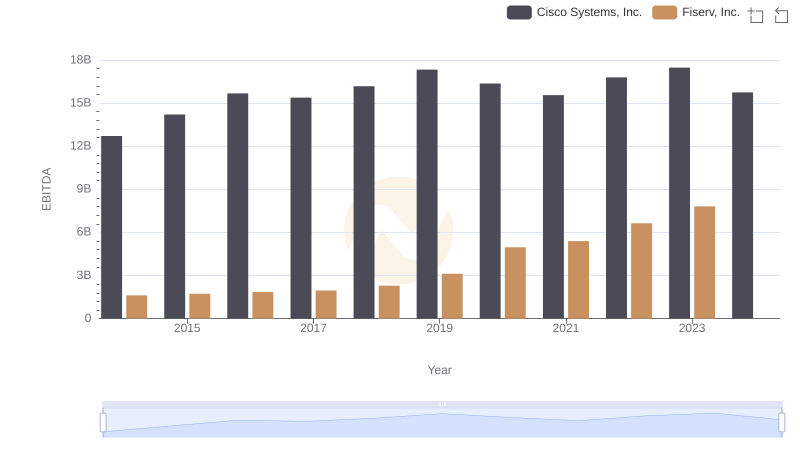
EBITDA Analysis: Evaluating Cisco Systems, Inc. Against Fiserv, Inc.
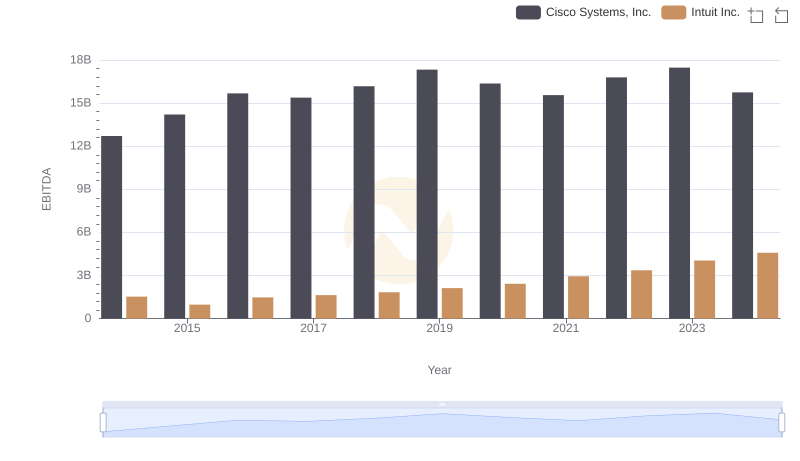
Cisco Systems, Inc. vs Intuit Inc.: In-Depth EBITDA Performance Comparison
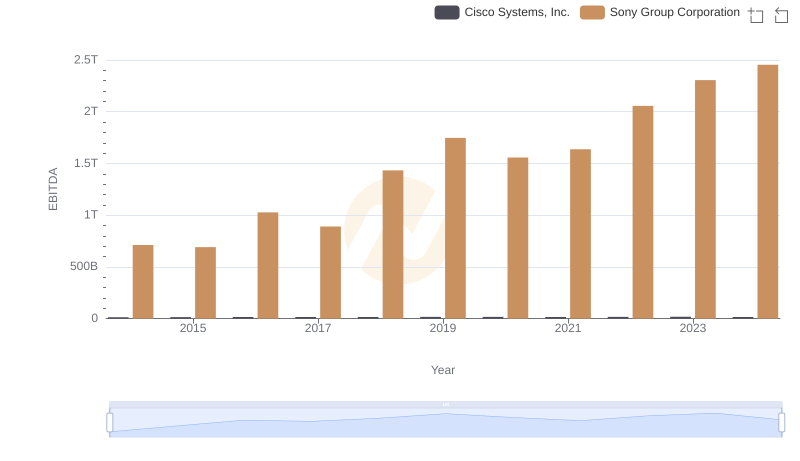
Comparative EBITDA Analysis: Cisco Systems, Inc. vs Sony Group Corporation
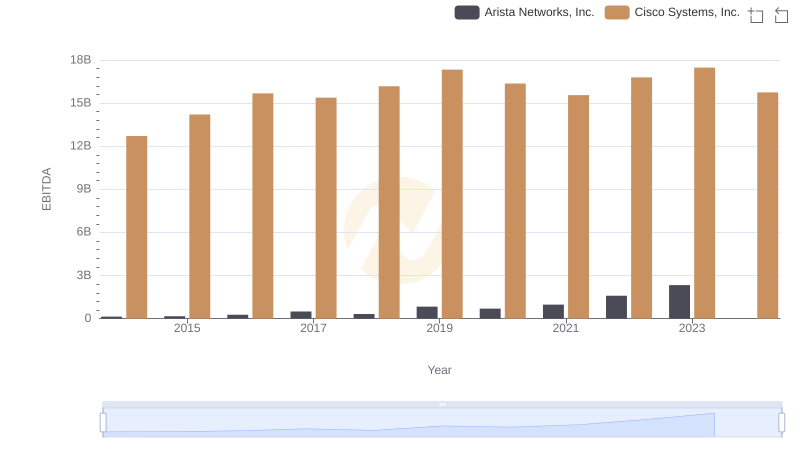
A Professional Review of EBITDA: Cisco Systems, Inc. Compared to Arista Networks, Inc.