| __timestamp | Cisco Systems, Inc. | Texas Instruments Incorporated |
|---|---|---|
| Wednesday, January 1, 2014 | 19373000000 | 5618000000 |
| Thursday, January 1, 2015 | 19480000000 | 5440000000 |
| Friday, January 1, 2016 | 18287000000 | 5130000000 |
| Sunday, January 1, 2017 | 17781000000 | 5347000000 |
| Monday, January 1, 2018 | 18724000000 | 5507000000 |
| Tuesday, January 1, 2019 | 19238000000 | 5219000000 |
| Wednesday, January 1, 2020 | 17618000000 | 5192000000 |
| Friday, January 1, 2021 | 17924000000 | 5968000000 |
| Saturday, January 1, 2022 | 19309000000 | 6257000000 |
| Sunday, January 1, 2023 | 21245000000 | 6500000000 |
| Monday, January 1, 2024 | 18975000000 | 6547000000 |
Unleashing insights
In the ever-evolving landscape of technology, Cisco Systems, Inc. and Texas Instruments Incorporated have been pivotal players. From 2014 to 2024, these industry titans have showcased distinct trajectories in their cost of revenue. Cisco's cost of revenue peaked in 2023, marking a 10% increase from its 2014 figures, while Texas Instruments saw a steady rise, culminating in a 16% growth over the same period. This divergence highlights Cisco's fluctuating operational costs, contrasting with Texas Instruments' consistent upward trend. The data reveals a fascinating narrative of strategic shifts and market adaptations. As we delve into these trends, it becomes evident that while both companies navigate the same industry waters, their paths are uniquely their own. This analysis not only underscores the dynamic nature of the tech industry but also offers insights into the operational strategies of these two giants.
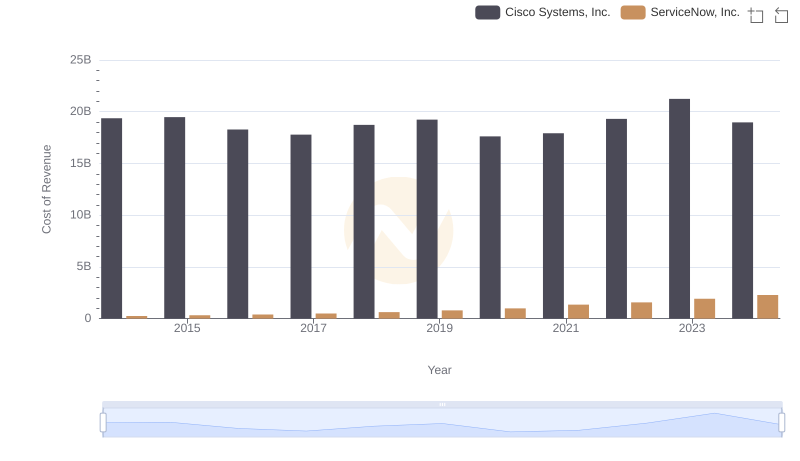
Analyzing Cost of Revenue: Cisco Systems, Inc. and ServiceNow, Inc.
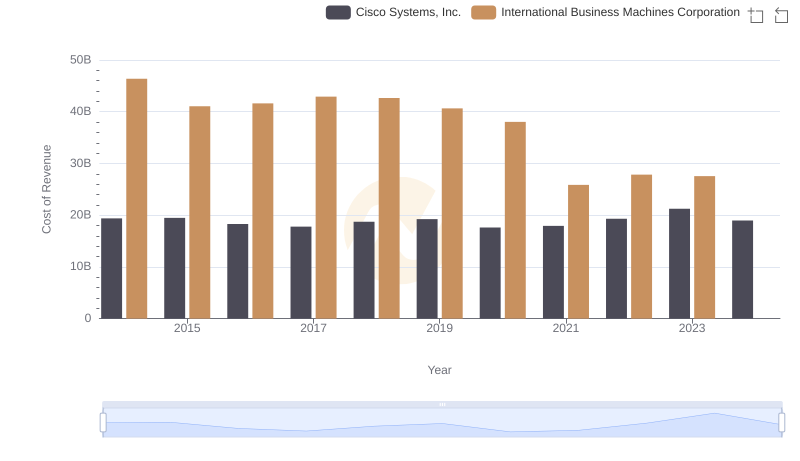
Cost Insights: Breaking Down Cisco Systems, Inc. and International Business Machines Corporation's Expenses
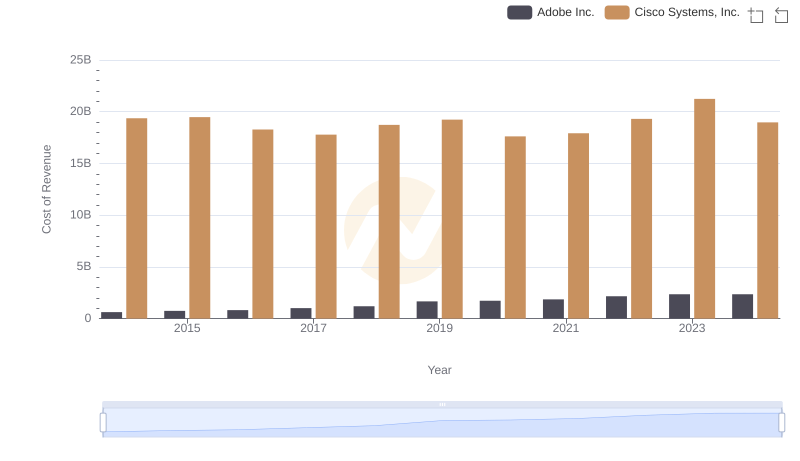
Comparing Cost of Revenue Efficiency: Cisco Systems, Inc. vs Adobe Inc.
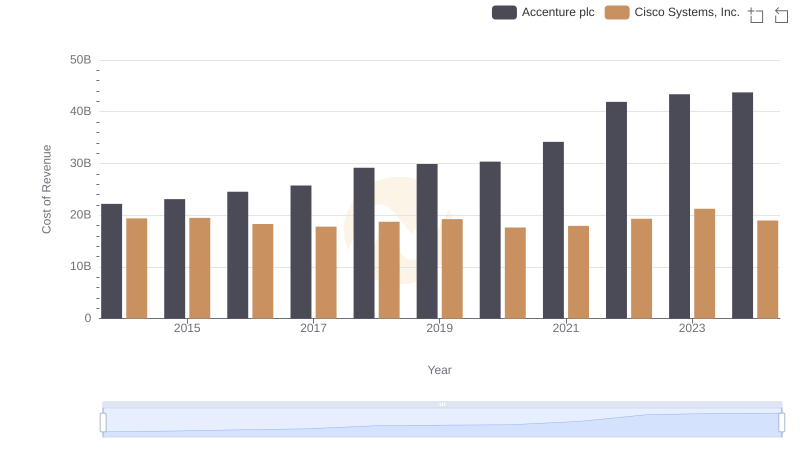
Analyzing Cost of Revenue: Cisco Systems, Inc. and Accenture plc
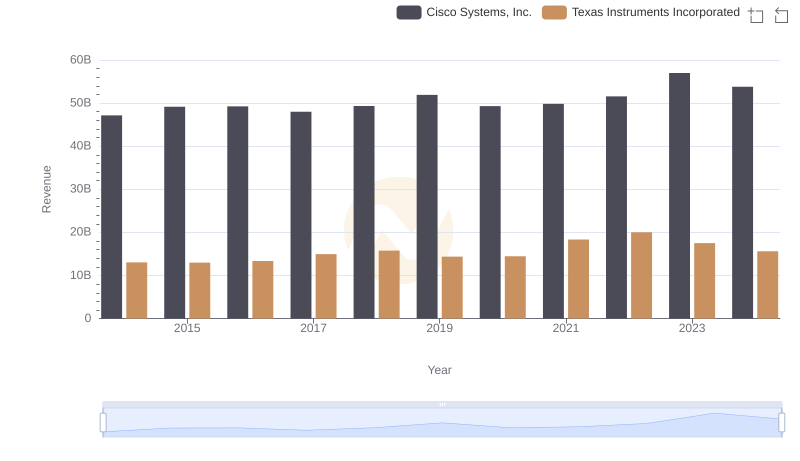
Breaking Down Revenue Trends: Cisco Systems, Inc. vs Texas Instruments Incorporated
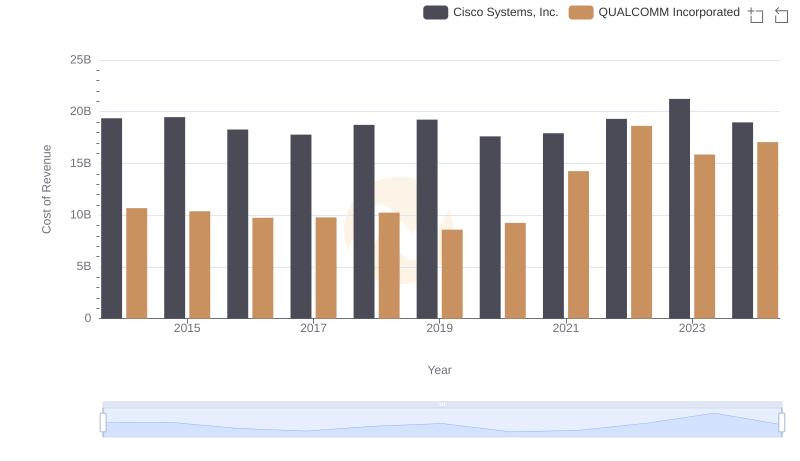
Cost of Revenue Comparison: Cisco Systems, Inc. vs QUALCOMM Incorporated
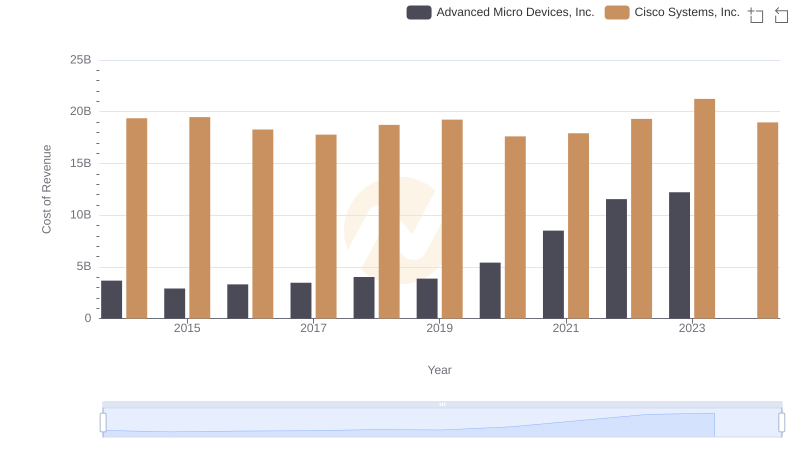
Cost of Revenue Trends: Cisco Systems, Inc. vs Advanced Micro Devices, Inc.
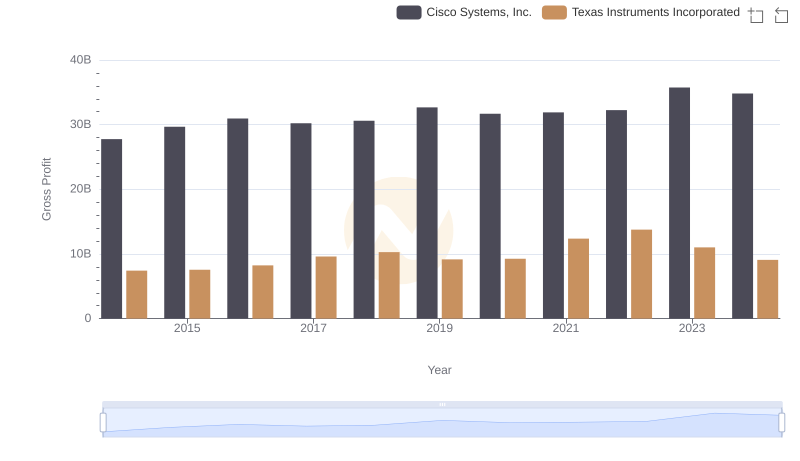
Cisco Systems, Inc. and Texas Instruments Incorporated: A Detailed Gross Profit Analysis
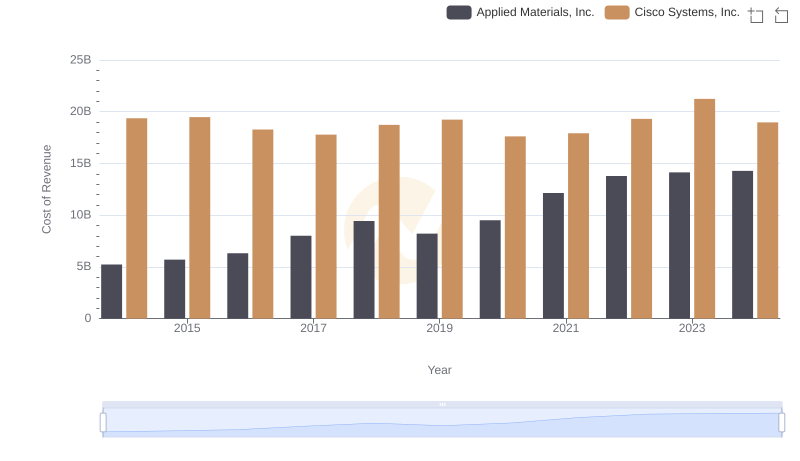
Cost of Revenue Trends: Cisco Systems, Inc. vs Applied Materials, Inc.
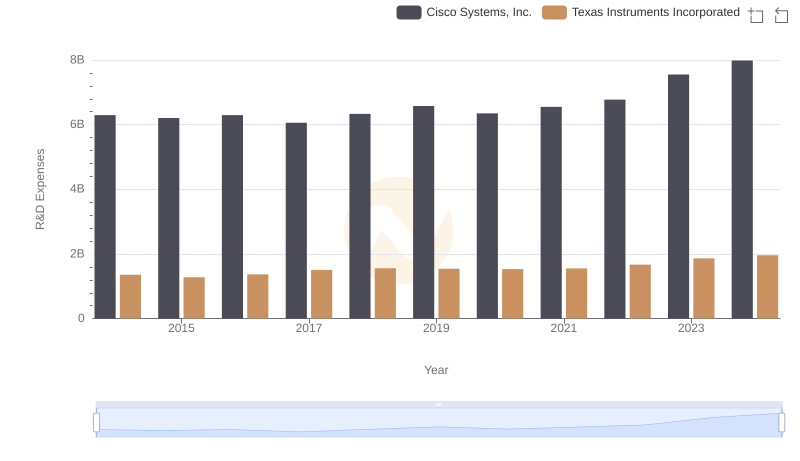
Research and Development: Comparing Key Metrics for Cisco Systems, Inc. and Texas Instruments Incorporated
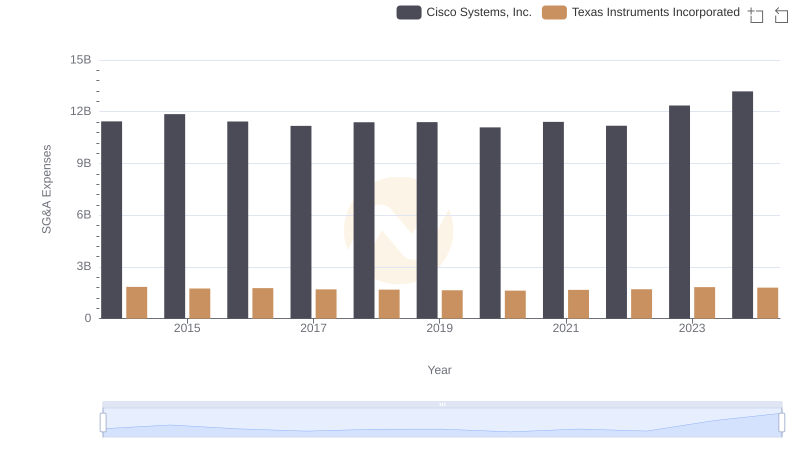
Cisco Systems, Inc. or Texas Instruments Incorporated: Who Manages SG&A Costs Better?
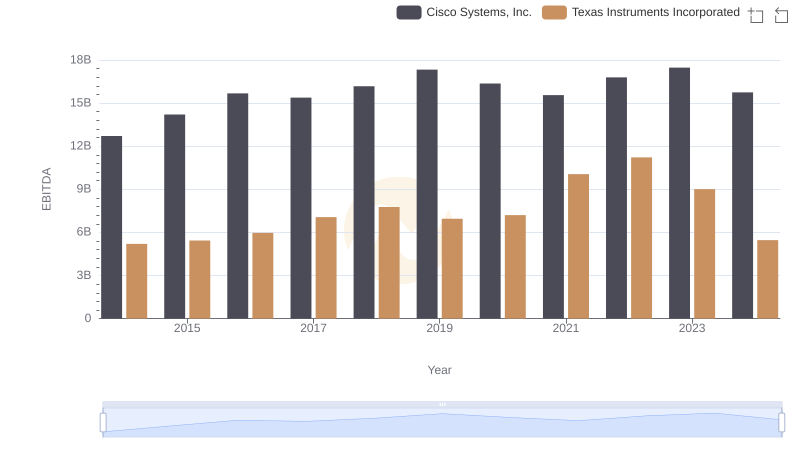
Cisco Systems, Inc. vs Texas Instruments Incorporated: In-Depth EBITDA Performance Comparison