| __timestamp | Applied Materials, Inc. | Cisco Systems, Inc. |
|---|---|---|
| Wednesday, January 1, 2014 | 890000000 | 11437000000 |
| Thursday, January 1, 2015 | 897000000 | 11861000000 |
| Friday, January 1, 2016 | 819000000 | 11433000000 |
| Sunday, January 1, 2017 | 890000000 | 11177000000 |
| Monday, January 1, 2018 | 1002000000 | 11386000000 |
| Tuesday, January 1, 2019 | 982000000 | 11398000000 |
| Wednesday, January 1, 2020 | 1093000000 | 11094000000 |
| Friday, January 1, 2021 | 1229000000 | 11411000000 |
| Saturday, January 1, 2022 | 1438000000 | 11186000000 |
| Sunday, January 1, 2023 | 1628000000 | 12358000000 |
| Monday, January 1, 2024 | 1797000000 | 13177000000 |
Unleashing the power of data
In the ever-evolving tech landscape, operational efficiency is paramount. Over the past decade, Cisco Systems, Inc. and Applied Materials, Inc. have showcased distinct trajectories in their Selling, General, and Administrative (SG&A) expenses. From 2014 to 2024, Cisco's SG&A expenses have consistently dwarfed those of Applied Materials, averaging nearly 10 times higher. Notably, Cisco's expenses peaked in 2024, marking a 15% increase from 2020. Meanwhile, Applied Materials demonstrated a steady rise, with a remarkable 64% growth over the same period. This divergence highlights Cisco's expansive operational scale compared to Applied Materials' more streamlined approach. As the tech industry continues to innovate, understanding these financial dynamics offers valuable insights into corporate strategies and market positioning.
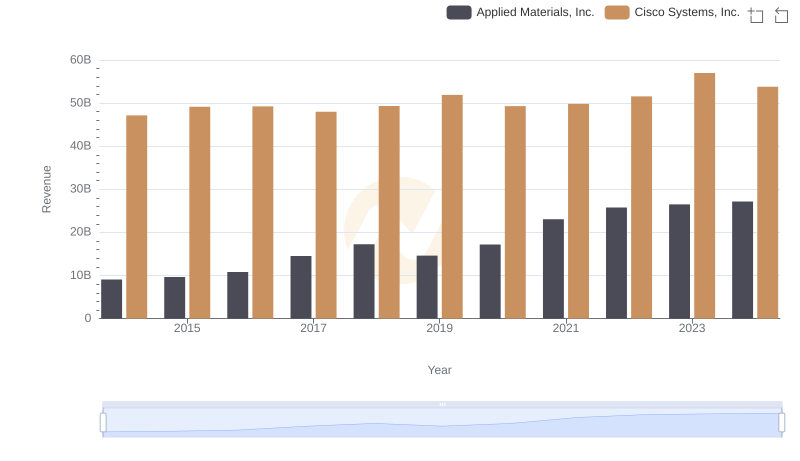
Cisco Systems, Inc. vs Applied Materials, Inc.: Annual Revenue Growth Compared
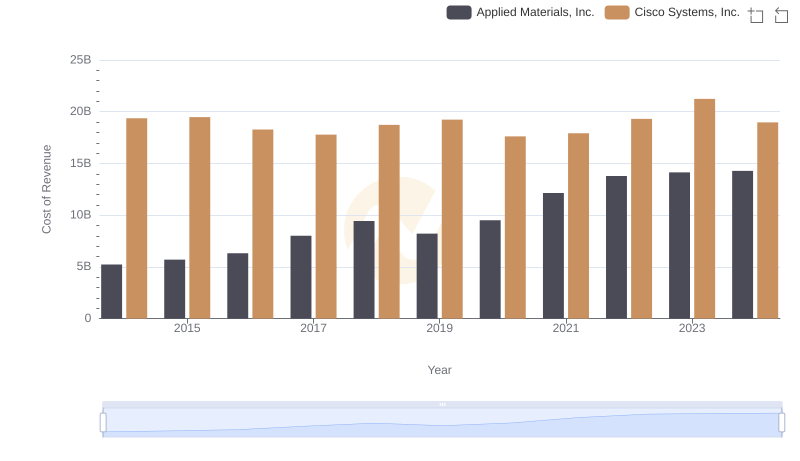
Cost of Revenue Trends: Cisco Systems, Inc. vs Applied Materials, Inc.
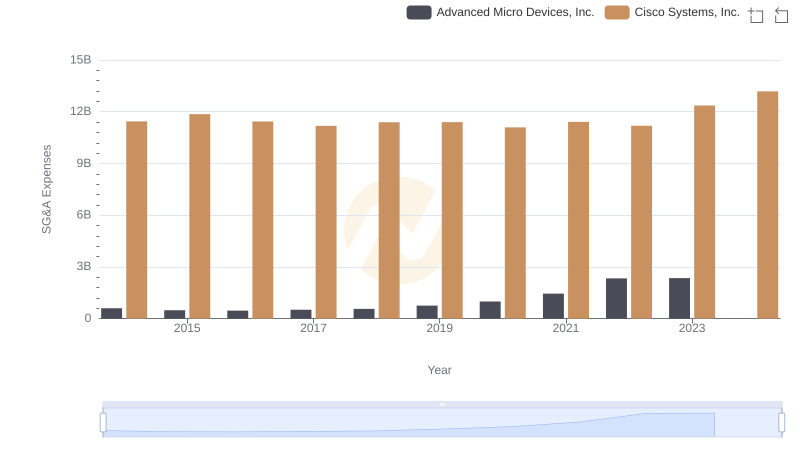
SG&A Efficiency Analysis: Comparing Cisco Systems, Inc. and Advanced Micro Devices, Inc.
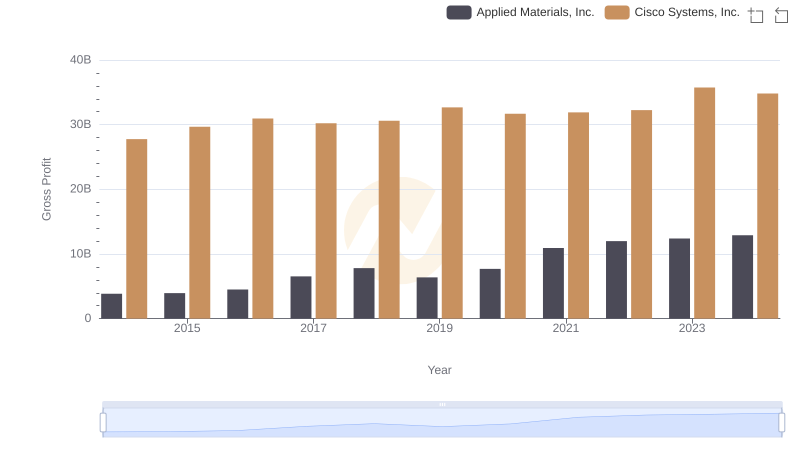
Gross Profit Analysis: Comparing Cisco Systems, Inc. and Applied Materials, Inc.
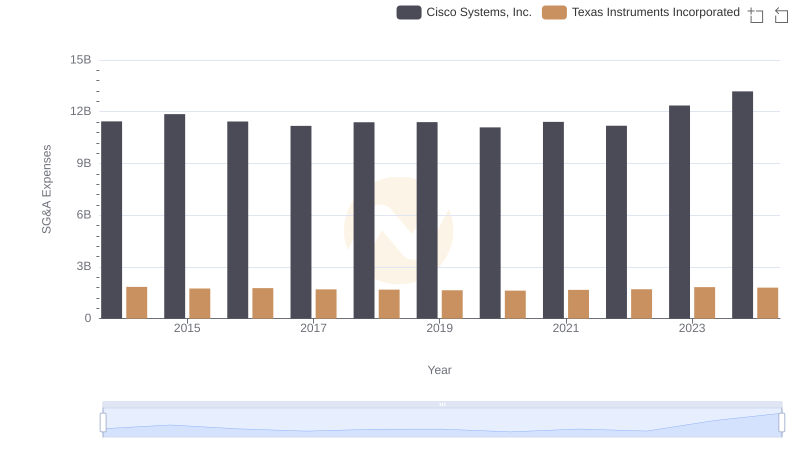
Cisco Systems, Inc. or Texas Instruments Incorporated: Who Manages SG&A Costs Better?
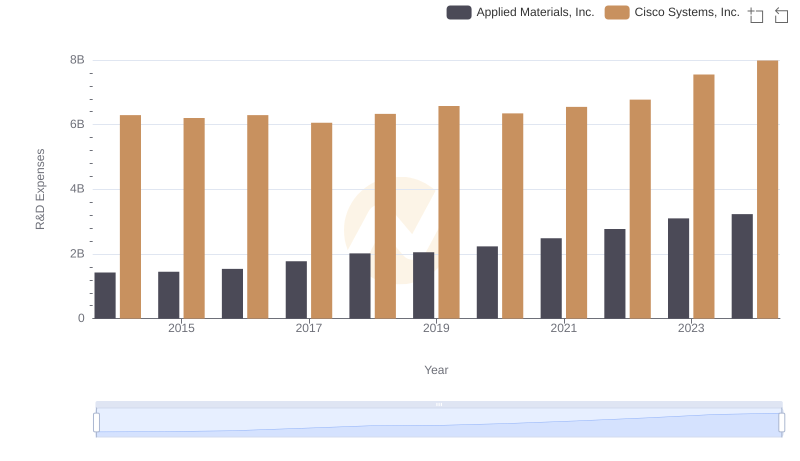
Cisco Systems, Inc. or Applied Materials, Inc.: Who Invests More in Innovation?
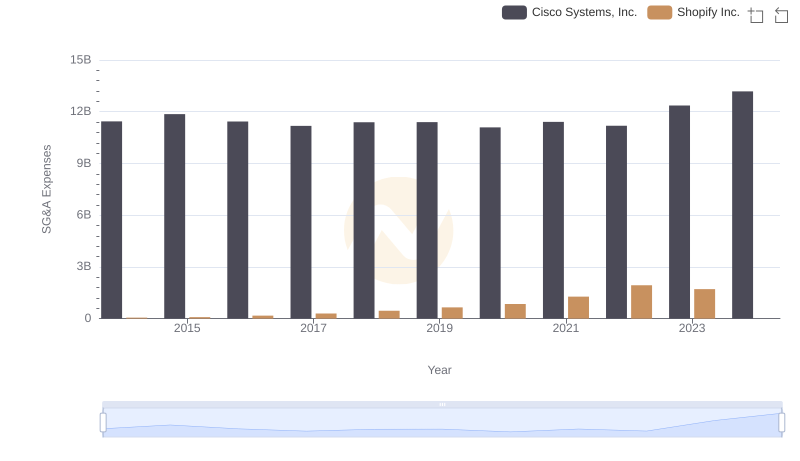
Cisco Systems, Inc. and Shopify Inc.: SG&A Spending Patterns Compared
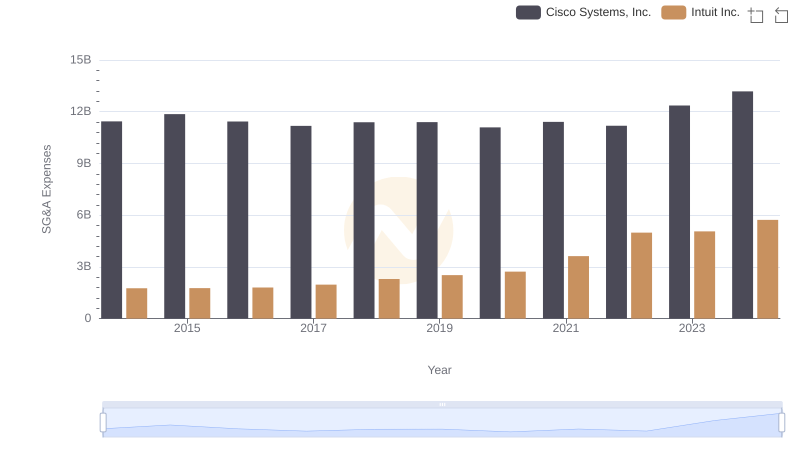
Cost Management Insights: SG&A Expenses for Cisco Systems, Inc. and Intuit Inc.
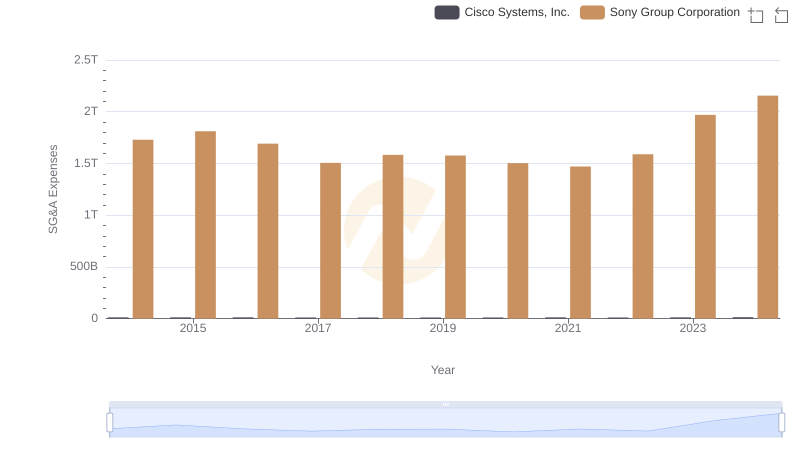
Comparing SG&A Expenses: Cisco Systems, Inc. vs Sony Group Corporation Trends and Insights
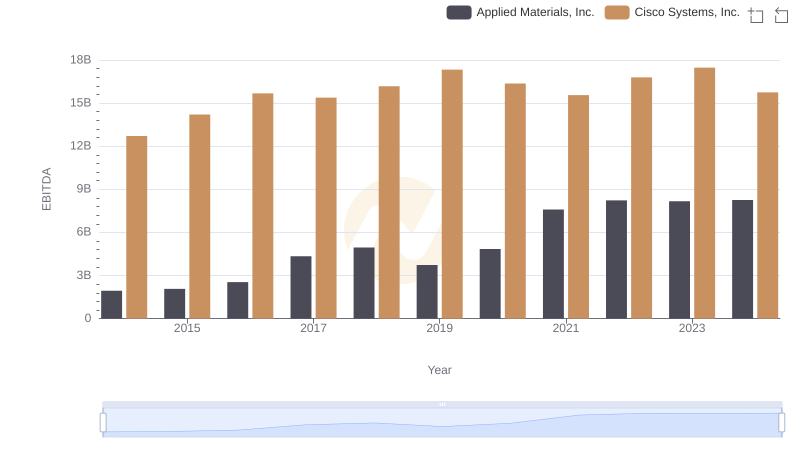
EBITDA Performance Review: Cisco Systems, Inc. vs Applied Materials, Inc.
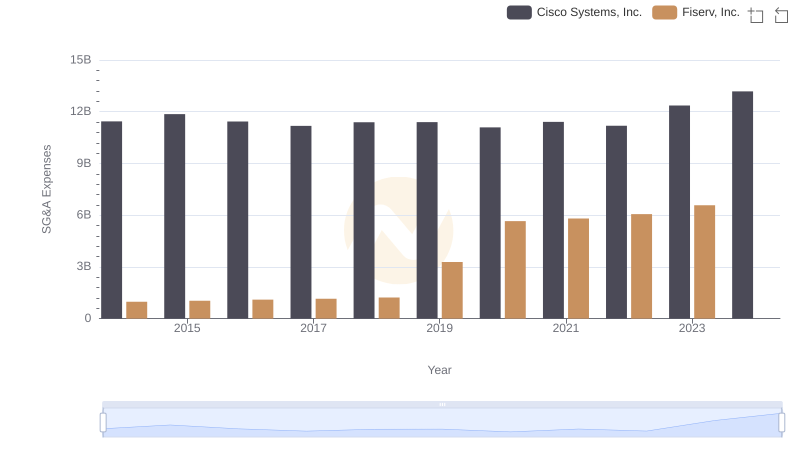
SG&A Efficiency Analysis: Comparing Cisco Systems, Inc. and Fiserv, Inc.

Comparing SG&A Expenses: Cisco Systems, Inc. vs Fiserv, Inc. Trends and Insights