| __timestamp | Cisco Systems, Inc. | Shopify Inc. |
|---|---|---|
| Wednesday, January 1, 2014 | 19373000000 | 43223000 |
| Thursday, January 1, 2015 | 19480000000 | 94162000 |
| Friday, January 1, 2016 | 18287000000 | 179835000 |
| Sunday, January 1, 2017 | 17781000000 | 293051000 |
| Monday, January 1, 2018 | 18724000000 | 476962000 |
| Tuesday, January 1, 2019 | 19238000000 | 712530000 |
| Wednesday, January 1, 2020 | 17618000000 | 1387971000 |
| Friday, January 1, 2021 | 17924000000 | 2130712000 |
| Saturday, January 1, 2022 | 19309000000 | 2845745000 |
| Sunday, January 1, 2023 | 21245000000 | 3545000000 |
| Monday, January 1, 2024 | 18975000000 | 4408000000 |
Unlocking the unknown
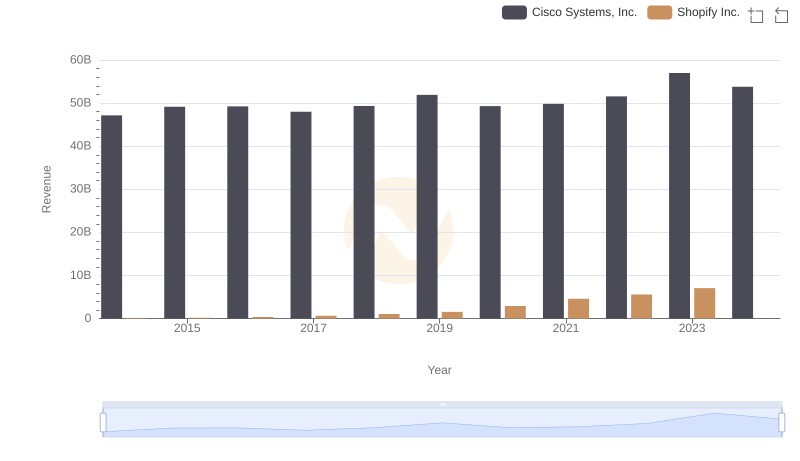
In the ever-evolving tech landscape, Cisco Systems, Inc. and Shopify Inc. stand as titans, each with unique business models and market strategies. From 2014 to 2023, Cisco's cost of revenue has shown remarkable stability, averaging around $19 billion annually, with a peak in 2023. This reflects its robust infrastructure and consistent demand for networking solutions. In contrast, Shopify's cost of revenue has skyrocketed, growing over 8,000% from 2014 to 2023, highlighting its rapid expansion in the e-commerce sector.
Cisco's cost of revenue dipped slightly in 2020, likely due to global disruptions, but rebounded by 2023. Meanwhile, Shopify's growth trajectory underscores its aggressive market capture, despite missing data for 2024. This comparison not only showcases the resilience of established players like Cisco but also the dynamic growth potential of newer entrants like Shopify.
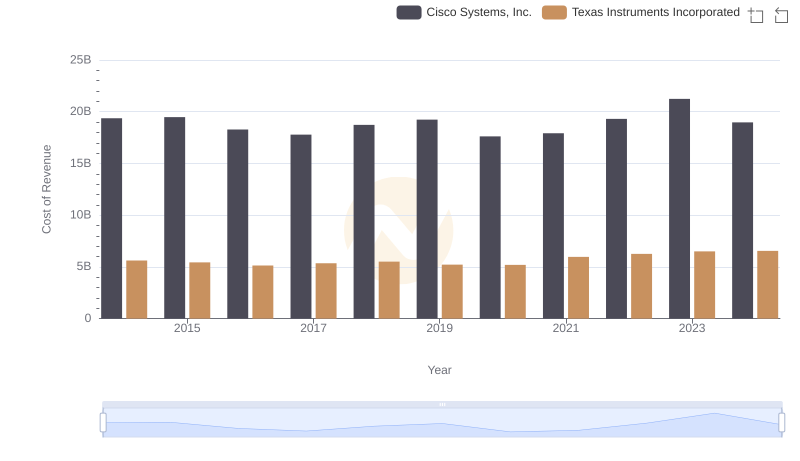
Cost of Revenue Trends: Cisco Systems, Inc. vs Texas Instruments Incorporated
Cisco Systems, Inc. vs Shopify Inc.: Examining Key Revenue Metrics
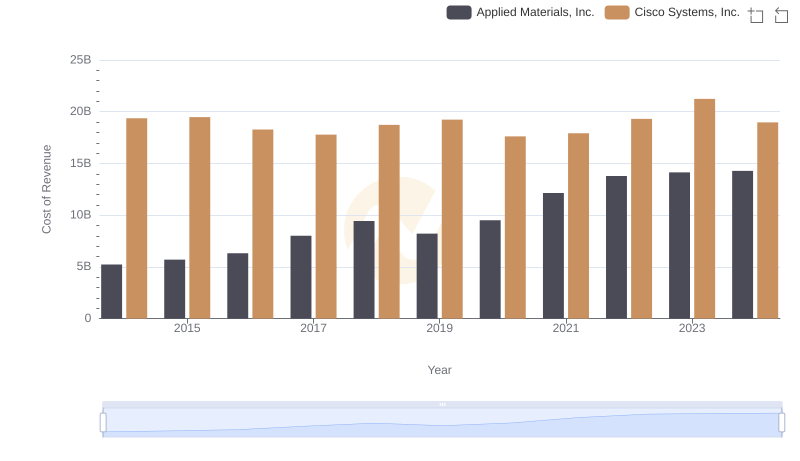
Cost of Revenue Trends: Cisco Systems, Inc. vs Applied Materials, Inc.
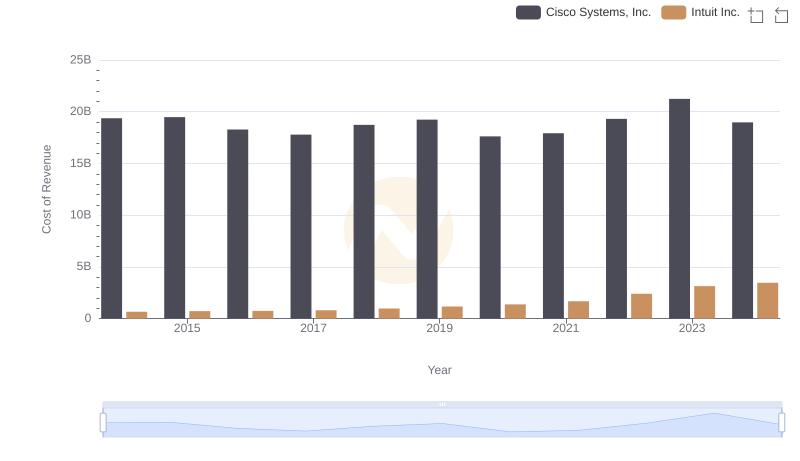
Cost of Revenue: Key Insights for Cisco Systems, Inc. and Intuit Inc.

Analyzing Cost of Revenue: Cisco Systems, Inc. and Fiserv, Inc.
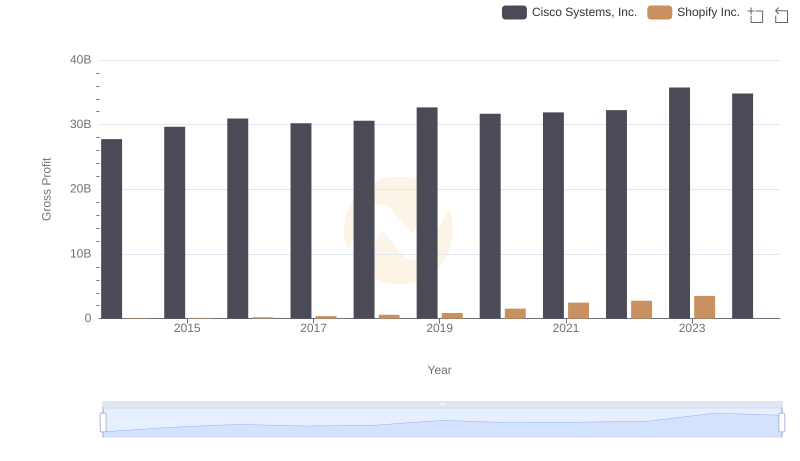
Gross Profit Analysis: Comparing Cisco Systems, Inc. and Shopify Inc.
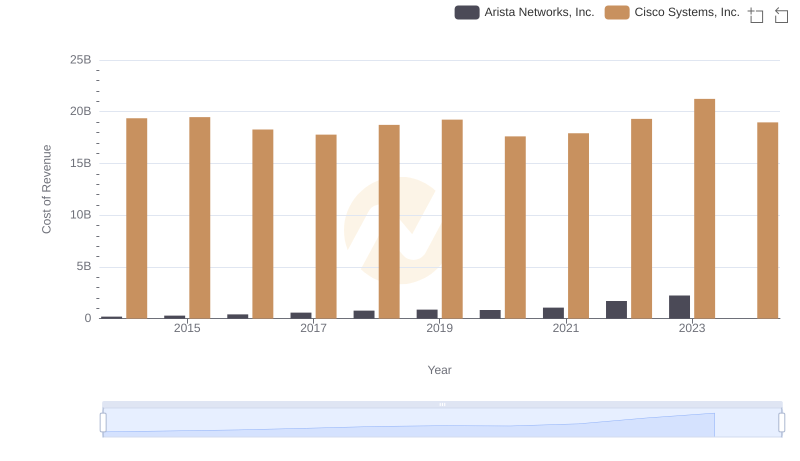
Analyzing Cost of Revenue: Cisco Systems, Inc. and Arista Networks, Inc.
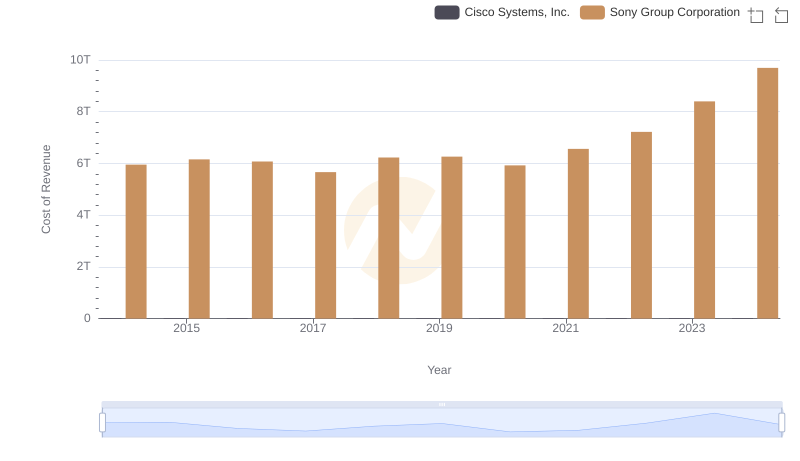
Cisco Systems, Inc. vs Sony Group Corporation: Efficiency in Cost of Revenue Explored
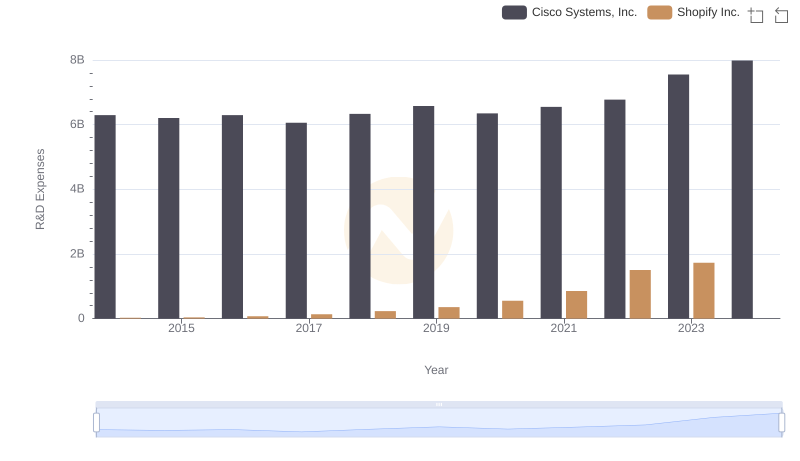
R&D Spending Showdown: Cisco Systems, Inc. vs Shopify Inc.

Cost of Revenue Trends: Cisco Systems, Inc. vs Palo Alto Networks, Inc.
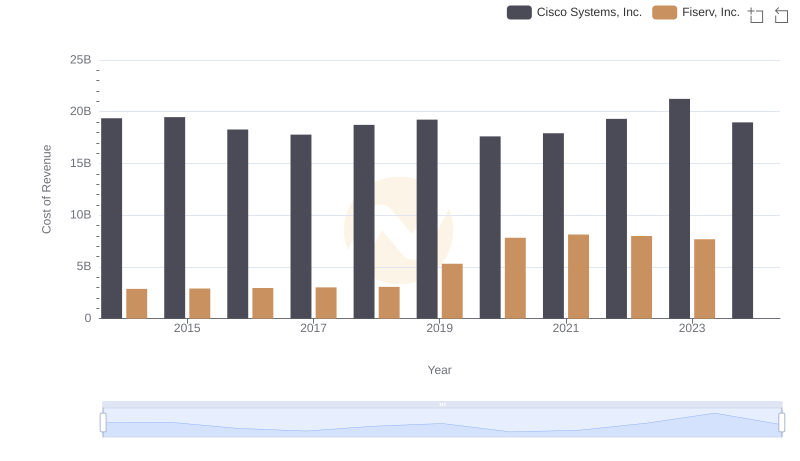
Cost of Revenue Comparison: Cisco Systems, Inc. vs Fiserv, Inc.
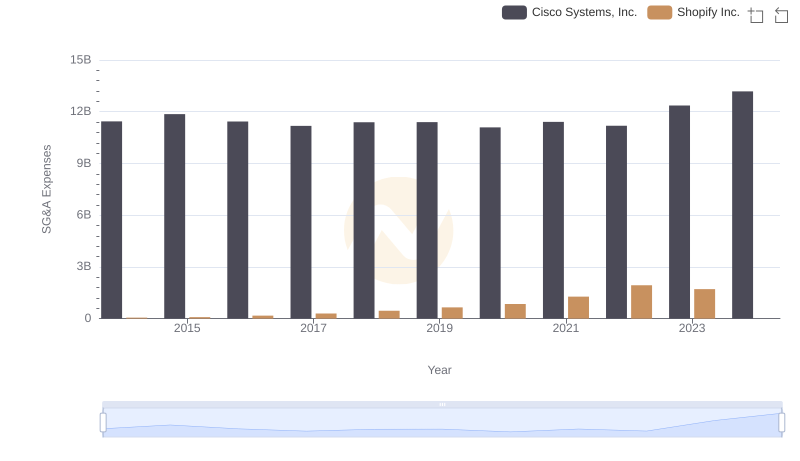
Cisco Systems, Inc. and Shopify Inc.: SG&A Spending Patterns Compared