| __timestamp | Applied Materials, Inc. | Cisco Systems, Inc. |
|---|---|---|
| Wednesday, January 1, 2014 | 3843000000 | 27769000000 |
| Thursday, January 1, 2015 | 3952000000 | 29681000000 |
| Friday, January 1, 2016 | 4511000000 | 30960000000 |
| Sunday, January 1, 2017 | 6532000000 | 30224000000 |
| Monday, January 1, 2018 | 7817000000 | 30606000000 |
| Tuesday, January 1, 2019 | 6386000000 | 32666000000 |
| Wednesday, January 1, 2020 | 7692000000 | 31683000000 |
| Friday, January 1, 2021 | 10914000000 | 31894000000 |
| Saturday, January 1, 2022 | 11993000000 | 32248000000 |
| Sunday, January 1, 2023 | 12384000000 | 35753000000 |
| Monday, January 1, 2024 | 12897000000 | 34828000000 |
Unveiling the hidden dimensions of data
In the ever-evolving tech industry, understanding financial health is crucial. This analysis compares the gross profit trends of two giants: Cisco Systems, Inc. and Applied Materials, Inc., from 2014 to 2024. Cisco consistently outperformed, with gross profits peaking at approximately $35.8 billion in 2023, a 29% increase from 2014. Meanwhile, Applied Materials showed impressive growth, with a 236% rise, reaching around $12.9 billion in 2024.
These trends underscore the dynamic nature of the tech industry, where strategic innovation and market adaptation are key to financial success.
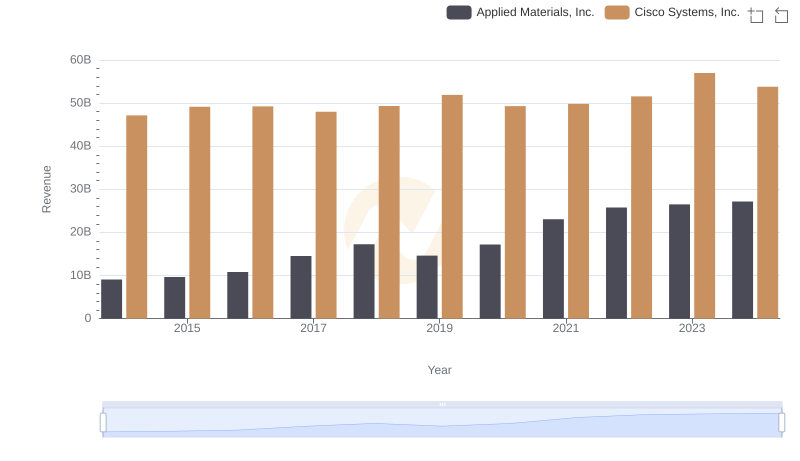
Cisco Systems, Inc. vs Applied Materials, Inc.: Annual Revenue Growth Compared
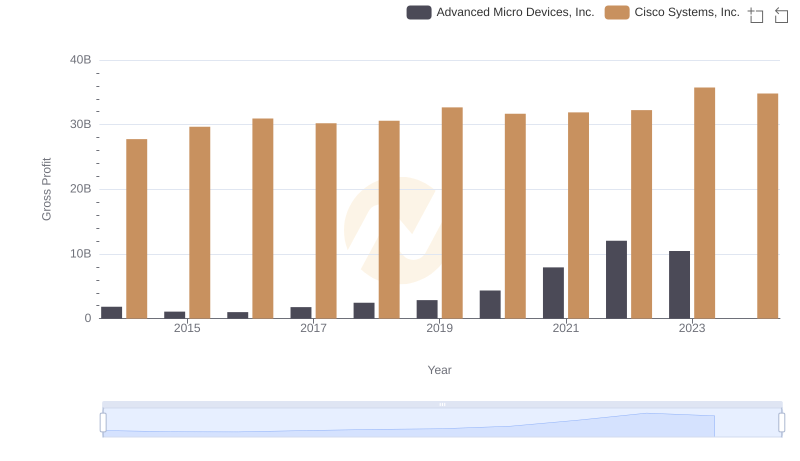
Cisco Systems, Inc. and Advanced Micro Devices, Inc.: A Detailed Gross Profit Analysis
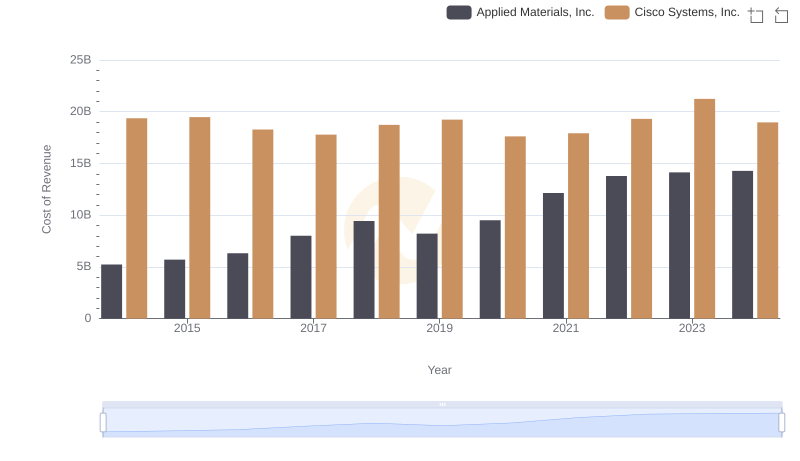
Cost of Revenue Trends: Cisco Systems, Inc. vs Applied Materials, Inc.
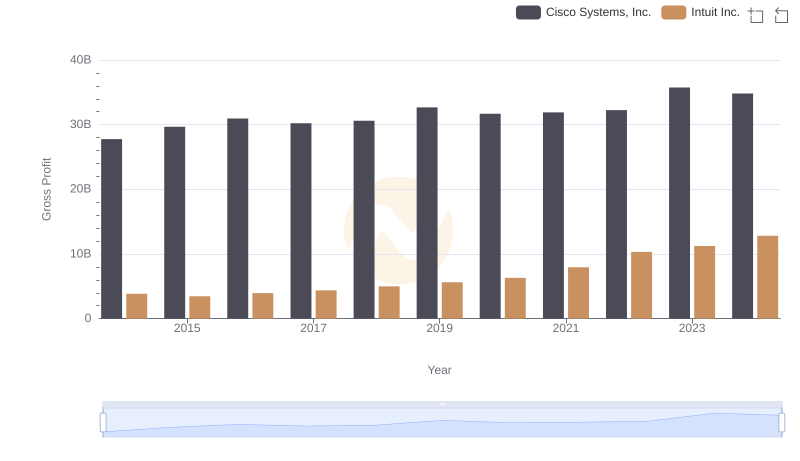
Who Generates Higher Gross Profit? Cisco Systems, Inc. or Intuit Inc.
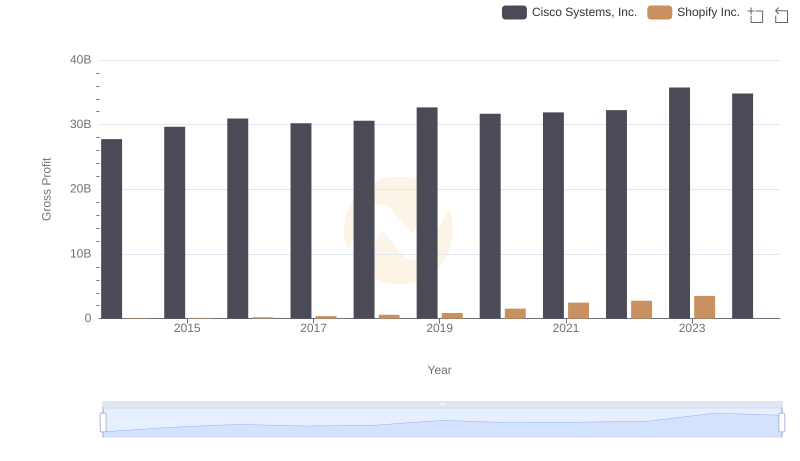
Gross Profit Analysis: Comparing Cisco Systems, Inc. and Shopify Inc.
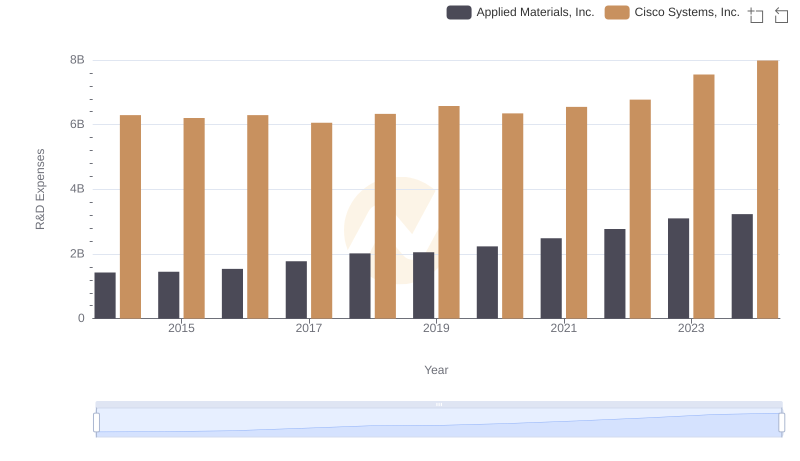
Cisco Systems, Inc. or Applied Materials, Inc.: Who Invests More in Innovation?
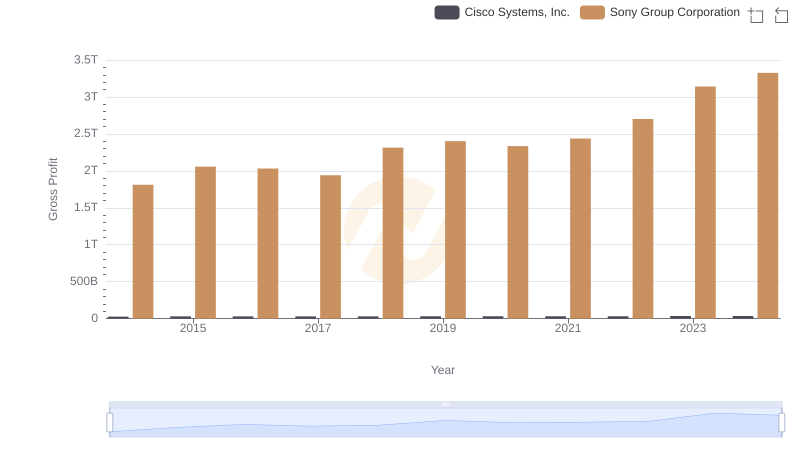
Who Generates Higher Gross Profit? Cisco Systems, Inc. or Sony Group Corporation
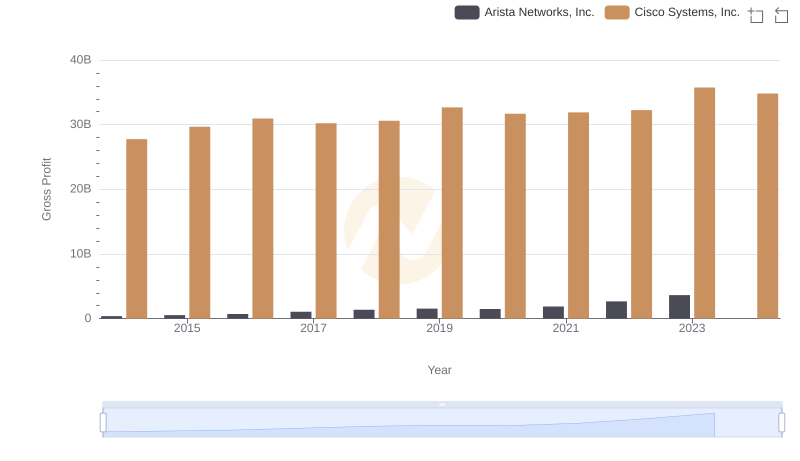
Gross Profit Trends Compared: Cisco Systems, Inc. vs Arista Networks, Inc.
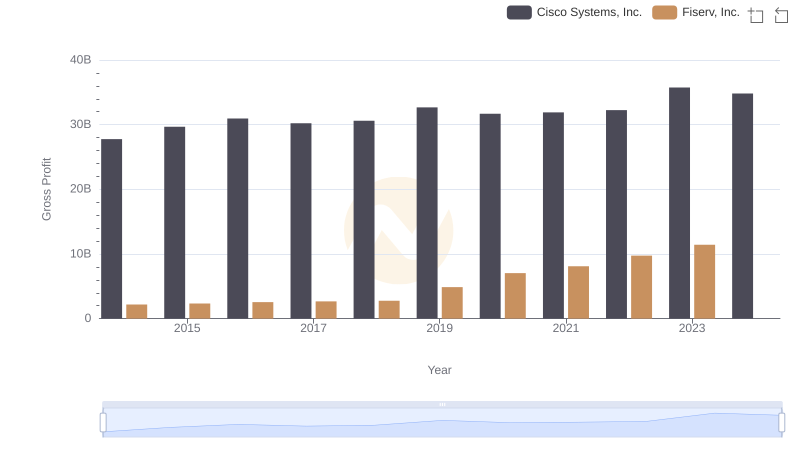
Key Insights on Gross Profit: Cisco Systems, Inc. vs Fiserv, Inc.
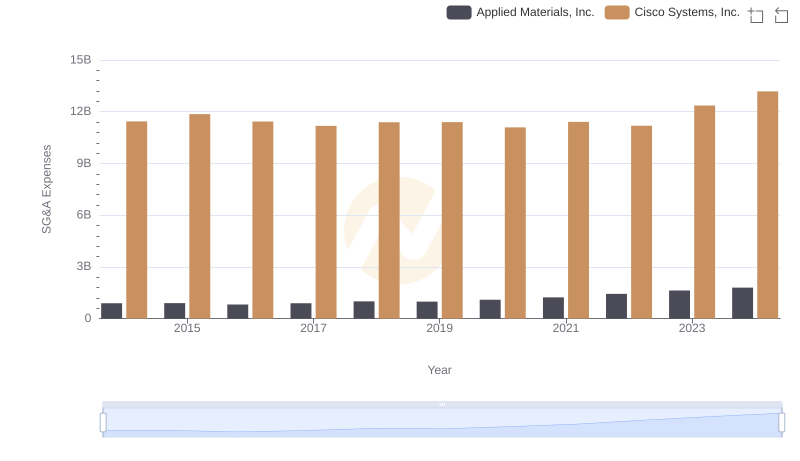
Operational Costs Compared: SG&A Analysis of Cisco Systems, Inc. and Applied Materials, Inc.
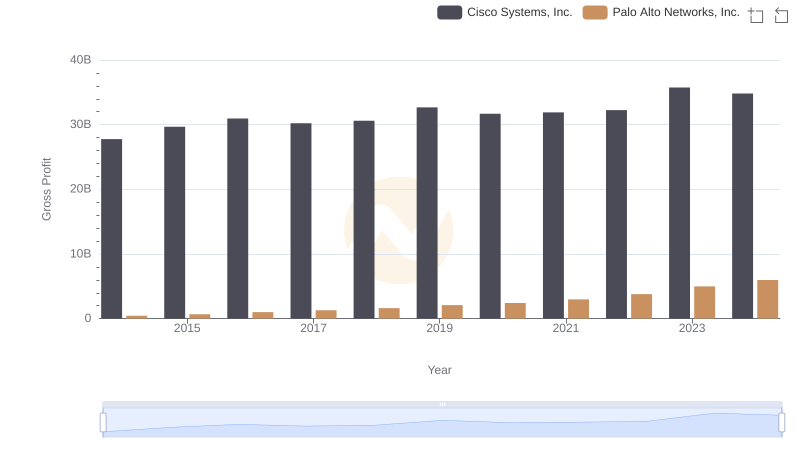
Who Generates Higher Gross Profit? Cisco Systems, Inc. or Palo Alto Networks, Inc.
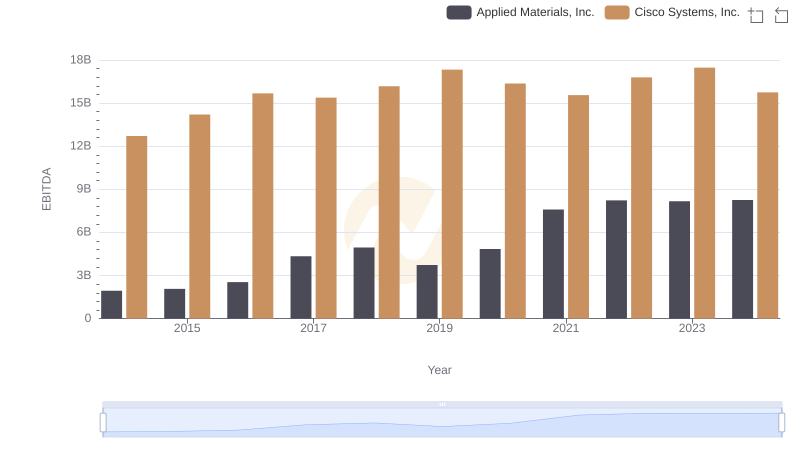
EBITDA Performance Review: Cisco Systems, Inc. vs Applied Materials, Inc.