| __timestamp | Cisco Systems, Inc. | Sony Group Corporation |
|---|---|---|
| Wednesday, January 1, 2014 | 19373000000 | 5956211000000 |
| Thursday, January 1, 2015 | 19480000000 | 6158134000000 |
| Friday, January 1, 2016 | 18287000000 | 6074652000000 |
| Sunday, January 1, 2017 | 17781000000 | 5663154000000 |
| Monday, January 1, 2018 | 18724000000 | 6230422000000 |
| Tuesday, January 1, 2019 | 19238000000 | 6263196000000 |
| Wednesday, January 1, 2020 | 17618000000 | 5925049000000 |
| Friday, January 1, 2021 | 17924000000 | 6561559000000 |
| Saturday, January 1, 2022 | 19309000000 | 7219841000000 |
| Sunday, January 1, 2023 | 21245000000 | 8398931000000 |
| Monday, January 1, 2024 | 18975000000 | 9695687000000 |
Igniting the spark of knowledge
In the ever-evolving landscape of global technology giants, understanding cost efficiency is crucial. Cisco Systems, Inc. and Sony Group Corporation, two titans in their respective fields, offer a fascinating study in contrasts. From 2014 to 2024, Cisco's cost of revenue has shown remarkable stability, averaging around $19 billion annually, with a slight dip in 2020. In contrast, Sony's cost of revenue has surged by approximately 63%, from $5.96 trillion in 2014 to a staggering $9.70 trillion in 2024.
This analysis underscores the diverse strategies of these industry leaders, offering valuable insights into their operational efficiencies.
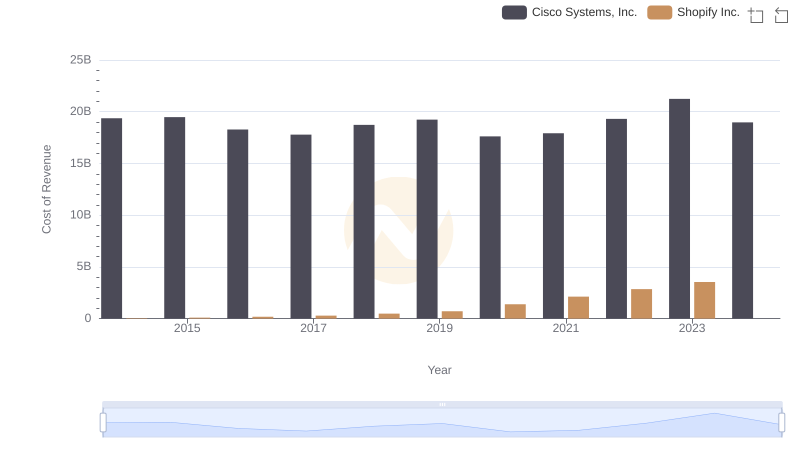
Cost of Revenue Comparison: Cisco Systems, Inc. vs Shopify Inc.
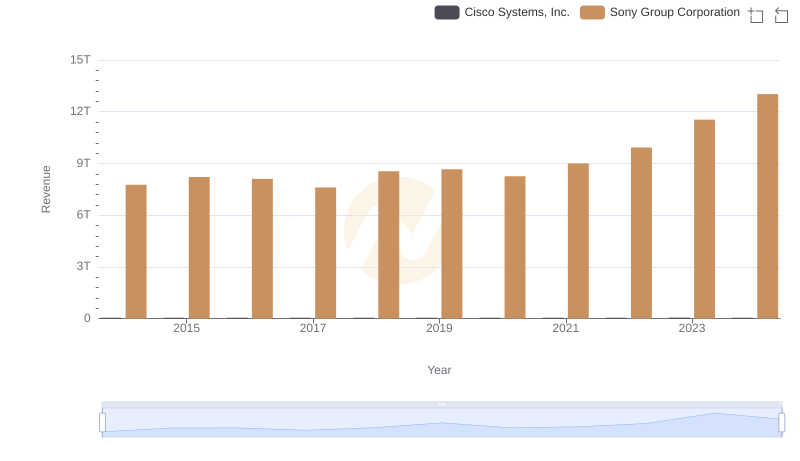
Breaking Down Revenue Trends: Cisco Systems, Inc. vs Sony Group Corporation
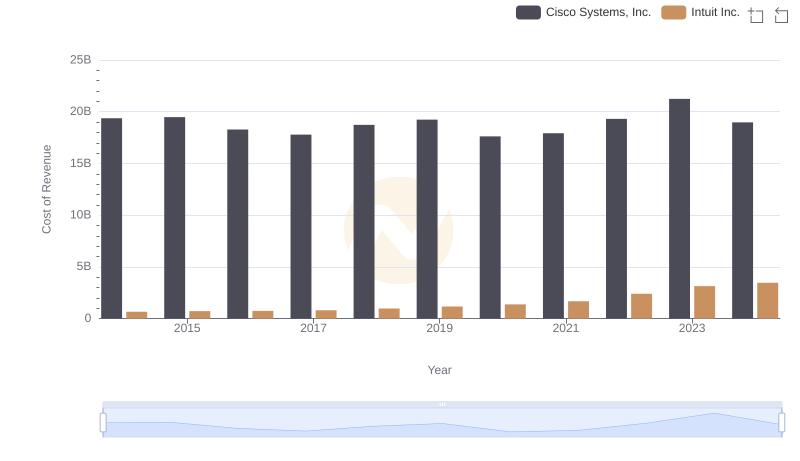
Cost of Revenue: Key Insights for Cisco Systems, Inc. and Intuit Inc.

Analyzing Cost of Revenue: Cisco Systems, Inc. and Fiserv, Inc.
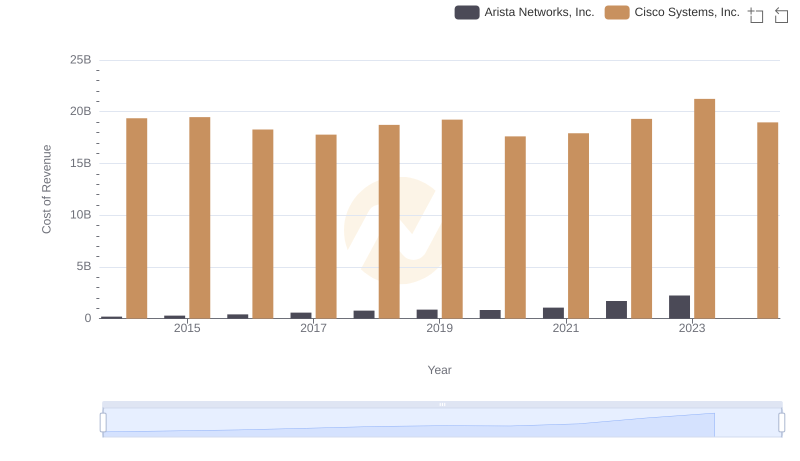
Analyzing Cost of Revenue: Cisco Systems, Inc. and Arista Networks, Inc.

Cost of Revenue Trends: Cisco Systems, Inc. vs Palo Alto Networks, Inc.
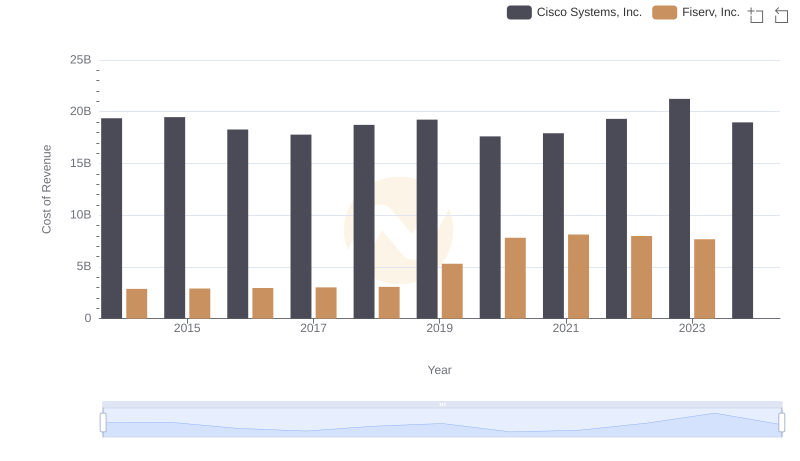
Cost of Revenue Comparison: Cisco Systems, Inc. vs Fiserv, Inc.
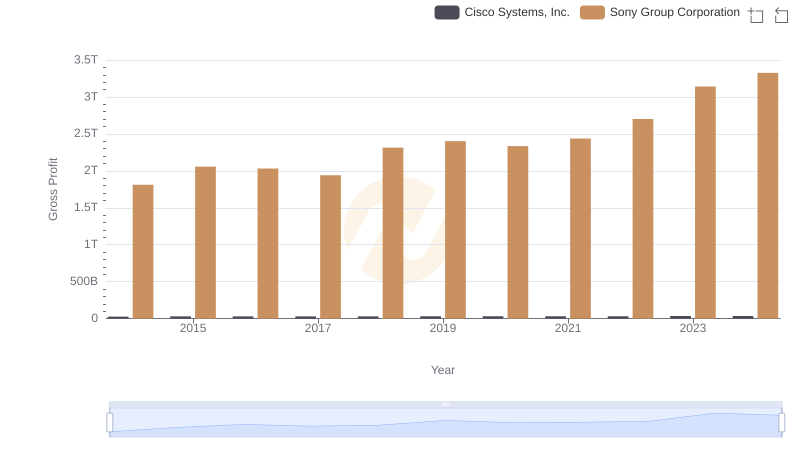
Who Generates Higher Gross Profit? Cisco Systems, Inc. or Sony Group Corporation
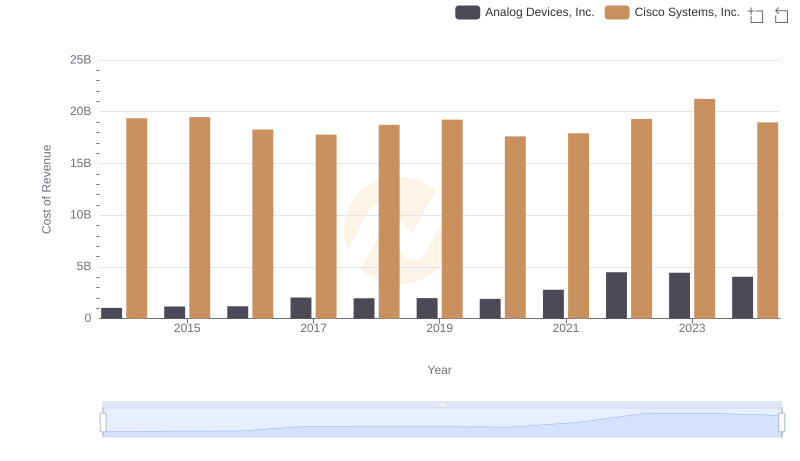
Comparing Cost of Revenue Efficiency: Cisco Systems, Inc. vs Analog Devices, Inc.
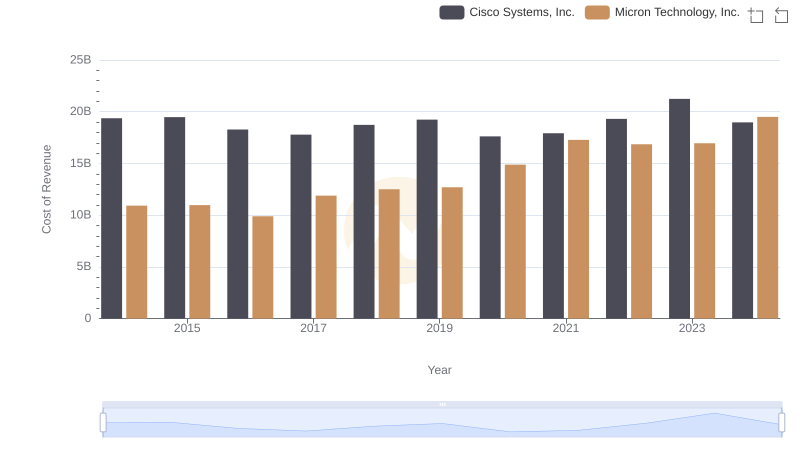
Analyzing Cost of Revenue: Cisco Systems, Inc. and Micron Technology, Inc.
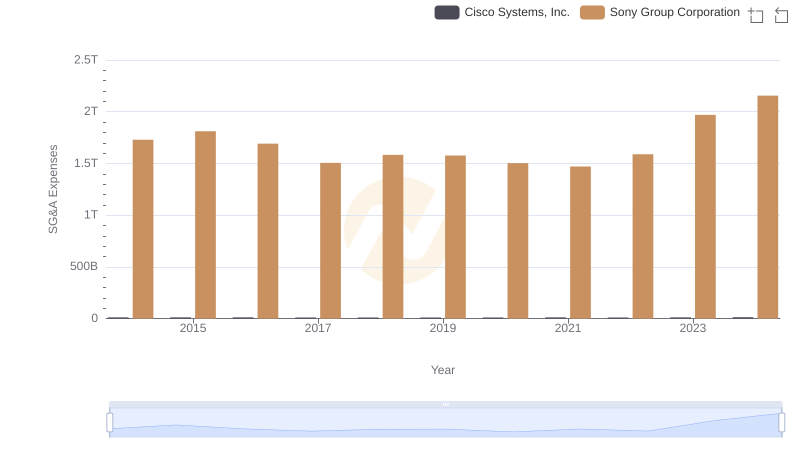
Comparing SG&A Expenses: Cisco Systems, Inc. vs Sony Group Corporation Trends and Insights
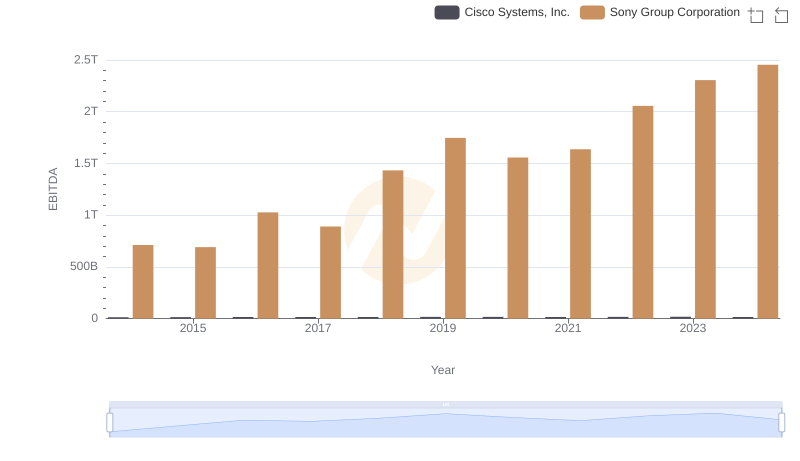
Comparative EBITDA Analysis: Cisco Systems, Inc. vs Sony Group Corporation