| __timestamp | AMETEK, Inc. | Owens Corning |
|---|---|---|
| Wednesday, January 1, 2014 | 2597017000 | 4300000000 |
| Thursday, January 1, 2015 | 2549280000 | 4197000000 |
| Friday, January 1, 2016 | 2575220000 | 4296000000 |
| Sunday, January 1, 2017 | 2851431000 | 4812000000 |
| Monday, January 1, 2018 | 3186310000 | 5425000000 |
| Tuesday, January 1, 2019 | 3370897000 | 5551000000 |
| Wednesday, January 1, 2020 | 2996515000 | 5445000000 |
| Friday, January 1, 2021 | 3633900000 | 6281000000 |
| Saturday, January 1, 2022 | 4005261000 | 7145000000 |
| Sunday, January 1, 2023 | 4212484999 | 6994000000 |
| Monday, January 1, 2024 | 0 |
Data in motion
In the ever-evolving landscape of industrial manufacturing, understanding cost dynamics is crucial. Over the past decade, AMETEK, Inc. and Owens Corning have showcased distinct trends in their cost of revenue. From 2014 to 2023, AMETEK, Inc. experienced a steady increase, with costs rising by approximately 62%, peaking in 2023. This growth reflects AMETEK's strategic investments and expansion efforts.
Conversely, Owens Corning's cost of revenue surged by about 63% from 2014 to 2022, before a slight dip in 2023. This fluctuation highlights the company's adaptive strategies in response to market demands and economic conditions.
These trends underscore the importance of cost management in maintaining competitive advantage. As both companies navigate the complexities of the global market, their cost strategies will be pivotal in shaping their future trajectories.
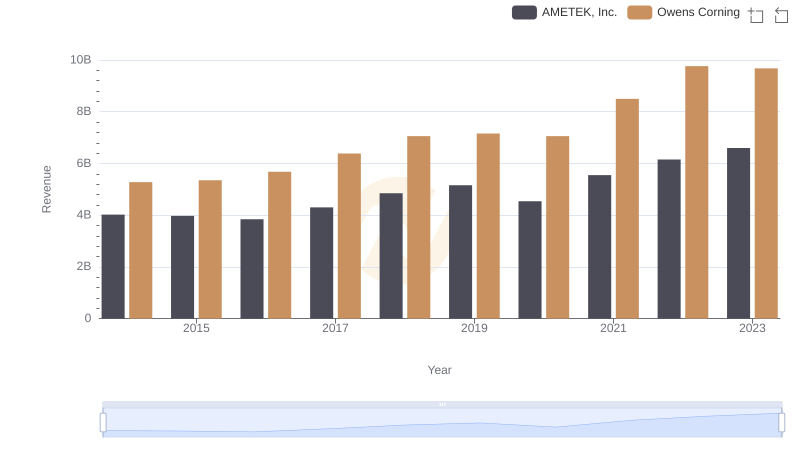
AMETEK, Inc. or Owens Corning: Who Leads in Yearly Revenue?
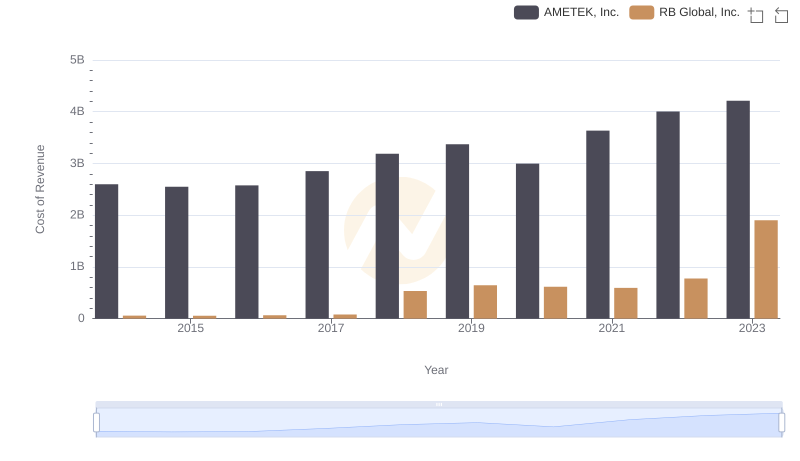
AMETEK, Inc. vs RB Global, Inc.: Efficiency in Cost of Revenue Explored
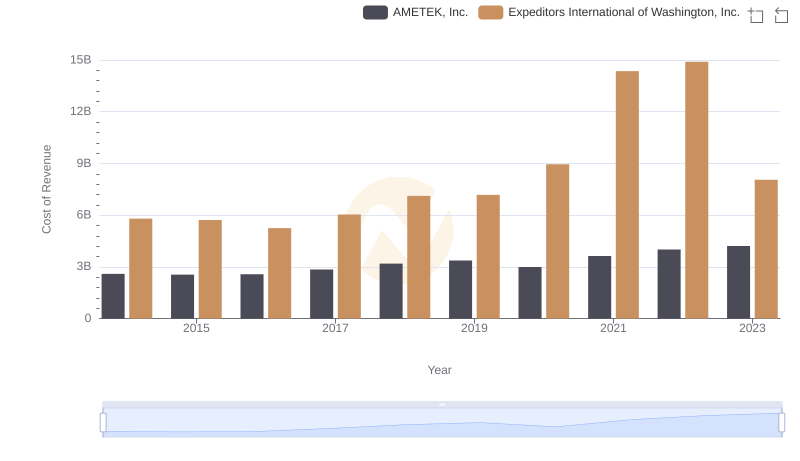
Cost of Revenue Comparison: AMETEK, Inc. vs Expeditors International of Washington, Inc.
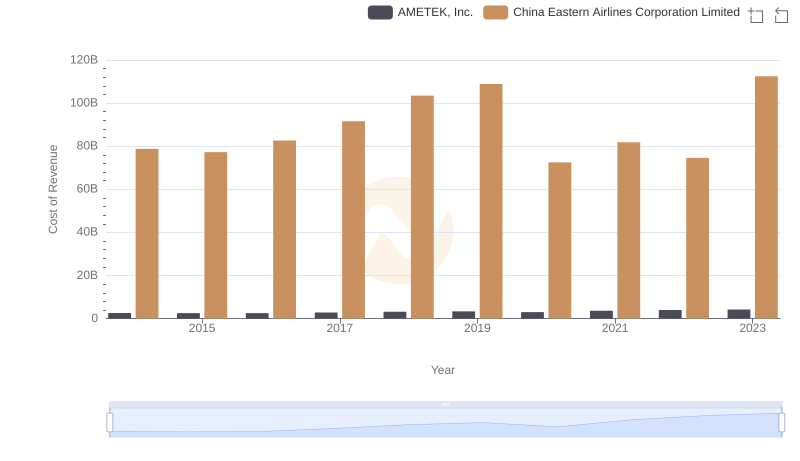
Comparing Cost of Revenue Efficiency: AMETEK, Inc. vs China Eastern Airlines Corporation Limited
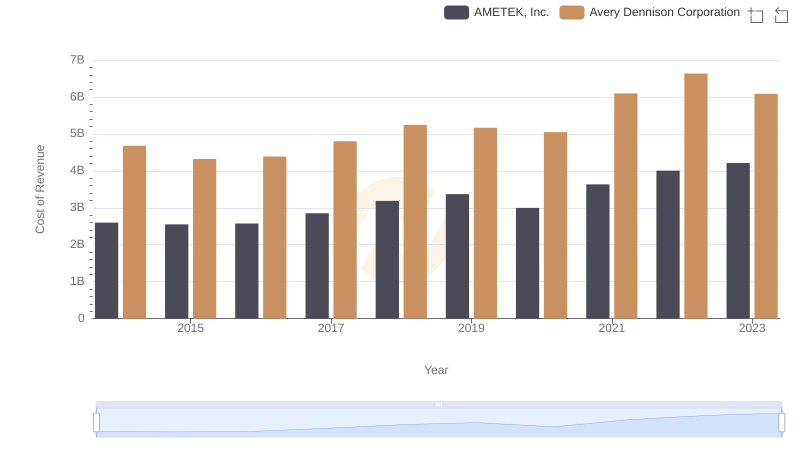
AMETEK, Inc. vs Avery Dennison Corporation: Efficiency in Cost of Revenue Explored
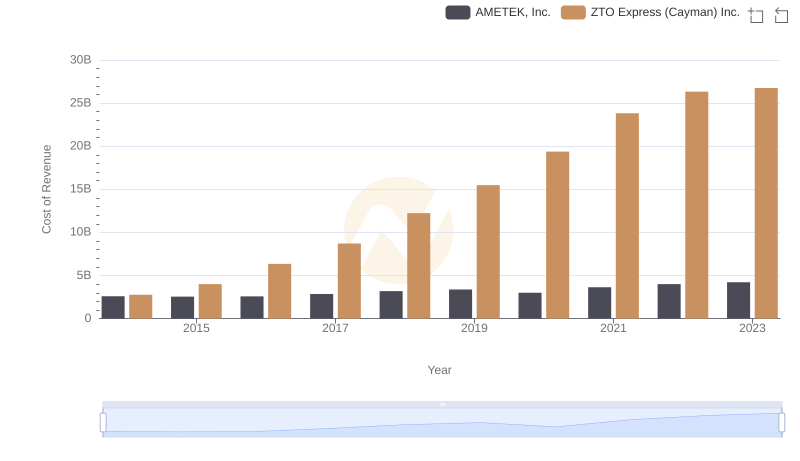
Cost Insights: Breaking Down AMETEK, Inc. and ZTO Express (Cayman) Inc.'s Expenses
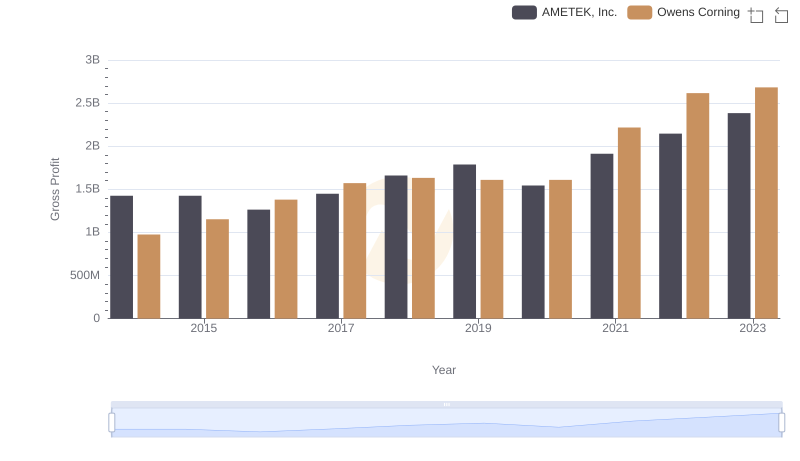
Who Generates Higher Gross Profit? AMETEK, Inc. or Owens Corning
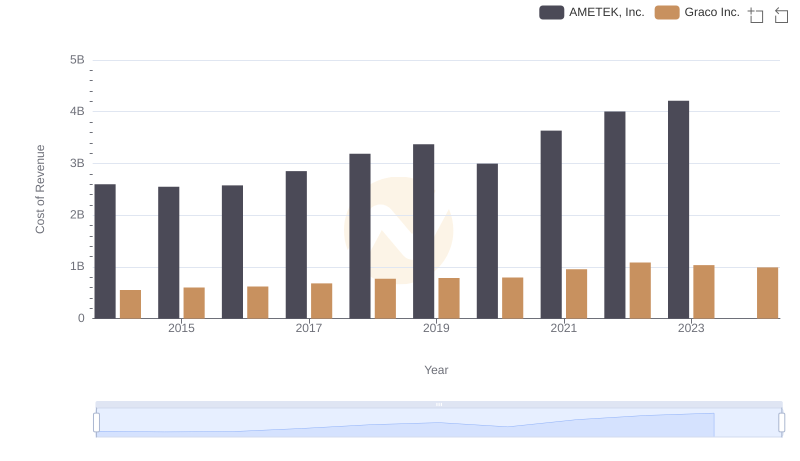
Cost of Revenue Trends: AMETEK, Inc. vs Graco Inc.
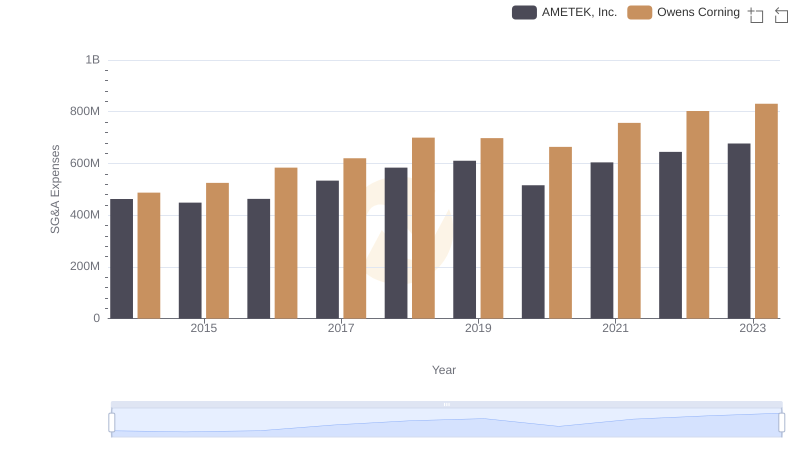
Comparing SG&A Expenses: AMETEK, Inc. vs Owens Corning Trends and Insights
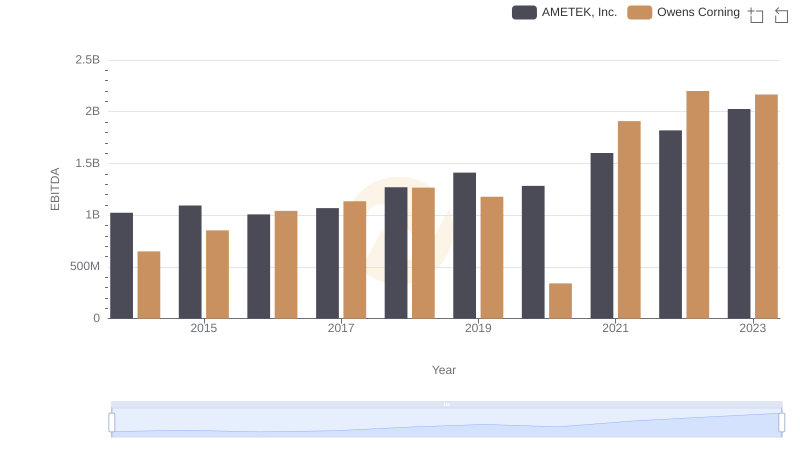
EBITDA Performance Review: AMETEK, Inc. vs Owens Corning