| __timestamp | AMETEK, Inc. | RB Global, Inc. |
|---|---|---|
| Wednesday, January 1, 2014 | 2597017000 | 57884000 |
| Thursday, January 1, 2015 | 2549280000 | 56026000 |
| Friday, January 1, 2016 | 2575220000 | 66062000 |
| Sunday, January 1, 2017 | 2851431000 | 79013000 |
| Monday, January 1, 2018 | 3186310000 | 533397000 |
| Tuesday, January 1, 2019 | 3370897000 | 645816000 |
| Wednesday, January 1, 2020 | 2996515000 | 615589000 |
| Friday, January 1, 2021 | 3633900000 | 594783000 |
| Saturday, January 1, 2022 | 4005261000 | 776701000 |
| Sunday, January 1, 2023 | 4212484999 | 1901200000 |
| Monday, January 1, 2024 | 0 | 0 |
Unleashing insights
In the ever-evolving landscape of industrial manufacturing, cost efficiency remains a pivotal factor for success. AMETEK, Inc. and RB Global, Inc. have showcased intriguing trends in their cost of revenue from 2014 to 2023. AMETEK, Inc. has consistently maintained a higher cost of revenue, peaking at approximately $4.2 billion in 2023, reflecting a 62% increase from 2014. In contrast, RB Global, Inc. experienced a dramatic surge, with its cost of revenue skyrocketing by over 3,000% during the same period, reaching nearly $1.9 billion in 2023. This stark contrast highlights AMETEK's steady growth and RB Global's aggressive expansion strategy. As these companies navigate the complexities of the global market, their cost efficiency strategies will undoubtedly play a crucial role in shaping their future trajectories.
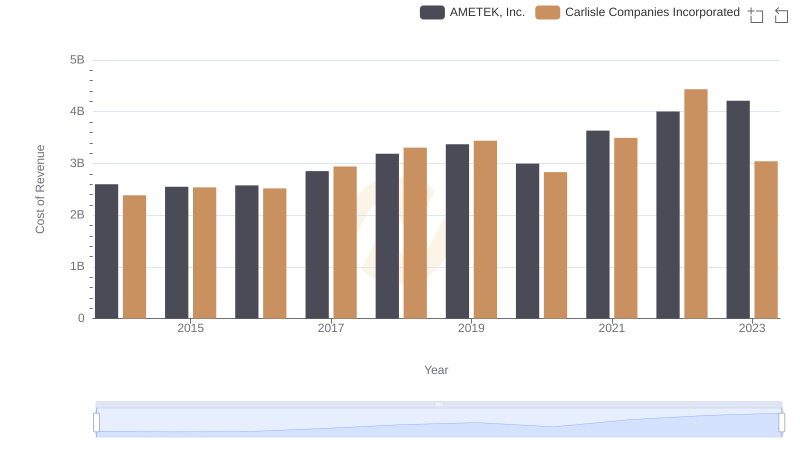
Cost of Revenue Comparison: AMETEK, Inc. vs Carlisle Companies Incorporated
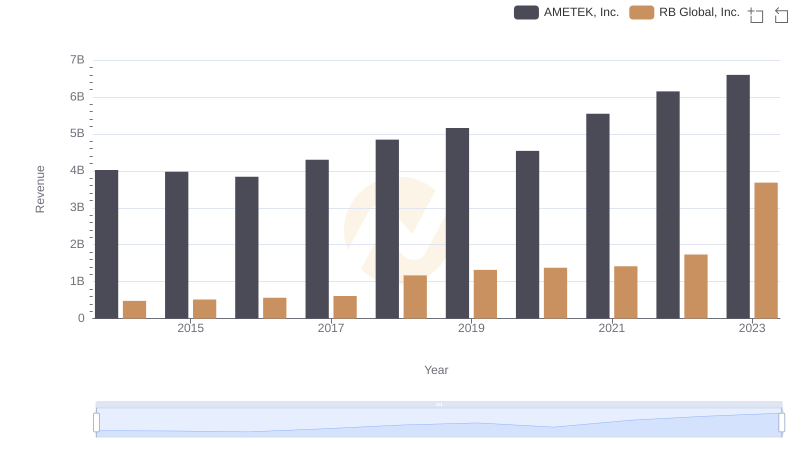
AMETEK, Inc. and RB Global, Inc.: A Comprehensive Revenue Analysis
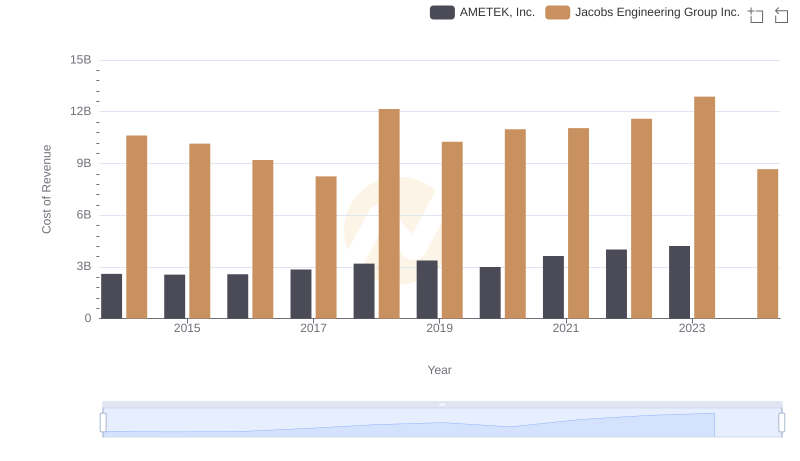
AMETEK, Inc. vs Jacobs Engineering Group Inc.: Efficiency in Cost of Revenue Explored
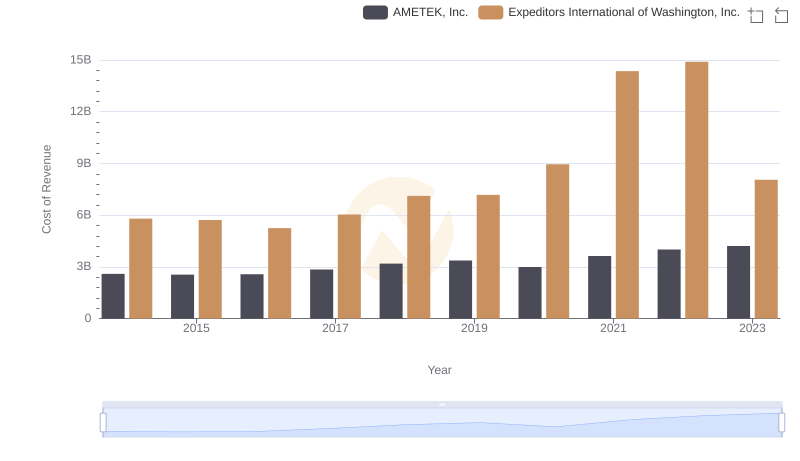
Cost of Revenue Comparison: AMETEK, Inc. vs Expeditors International of Washington, Inc.
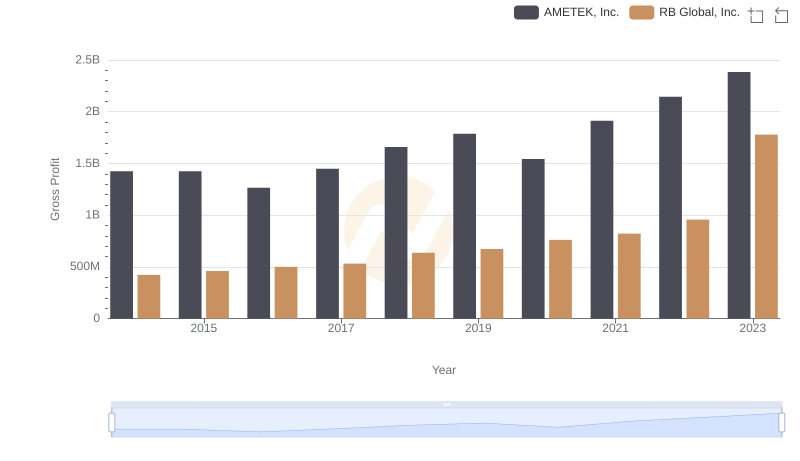
Who Generates Higher Gross Profit? AMETEK, Inc. or RB Global, Inc.
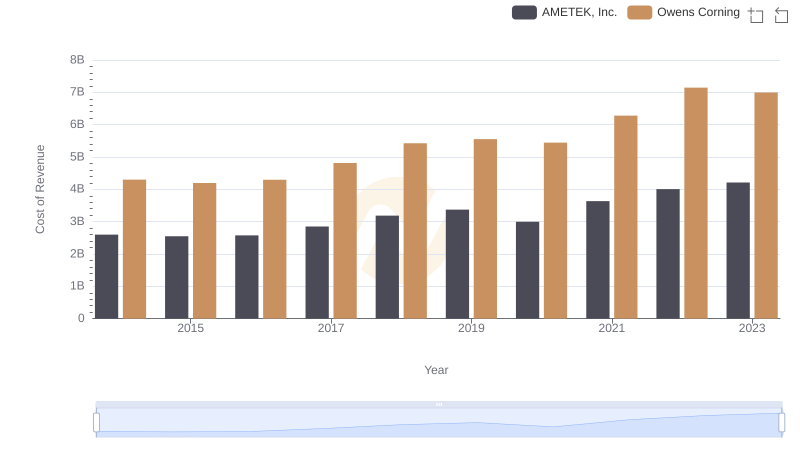
Cost of Revenue Trends: AMETEK, Inc. vs Owens Corning
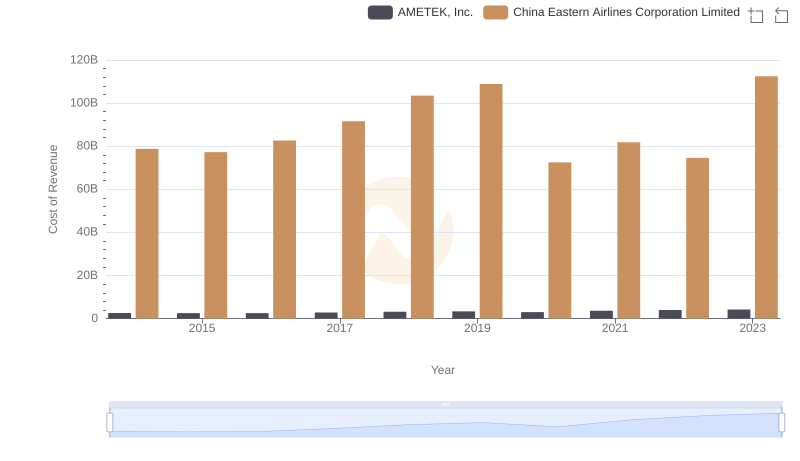
Comparing Cost of Revenue Efficiency: AMETEK, Inc. vs China Eastern Airlines Corporation Limited
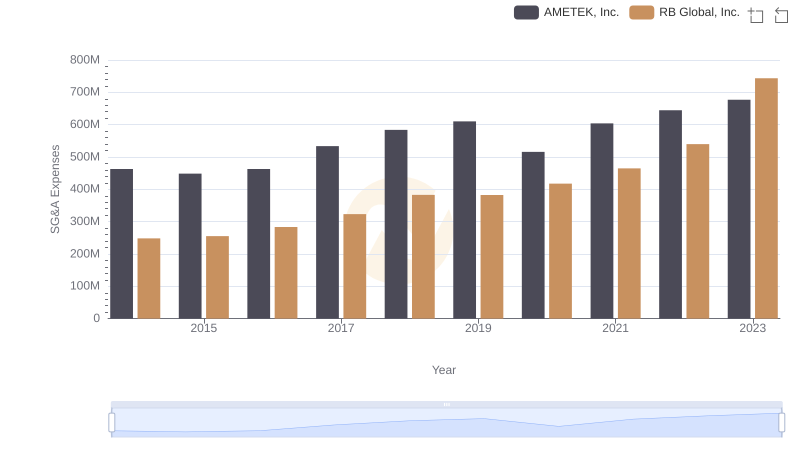
AMETEK, Inc. and RB Global, Inc.: SG&A Spending Patterns Compared
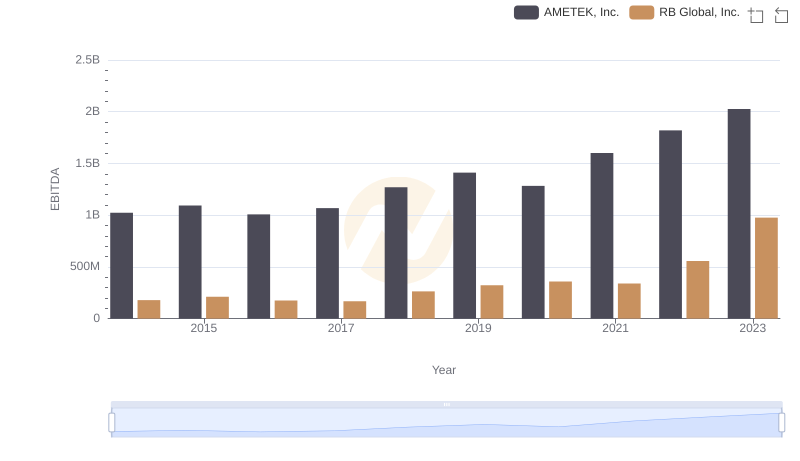
A Professional Review of EBITDA: AMETEK, Inc. Compared to RB Global, Inc.