| __timestamp | AMETEK, Inc. | Graco Inc. |
|---|---|---|
| Wednesday, January 1, 2014 | 2597017000 | 554394000 |
| Thursday, January 1, 2015 | 2549280000 | 601785000 |
| Friday, January 1, 2016 | 2575220000 | 621054000 |
| Sunday, January 1, 2017 | 2851431000 | 681695000 |
| Monday, January 1, 2018 | 3186310000 | 770753000 |
| Tuesday, January 1, 2019 | 3370897000 | 786289000 |
| Wednesday, January 1, 2020 | 2996515000 | 795178000 |
| Friday, January 1, 2021 | 3633900000 | 953659000 |
| Saturday, January 1, 2022 | 4005261000 | 1086082000 |
| Sunday, January 1, 2023 | 4212484999 | 1034585000 |
| Monday, January 1, 2024 | 0 | 990855000 |
Unleashing insights
In the competitive landscape of industrial manufacturing, AMETEK, Inc. and Graco Inc. have shown distinct trajectories in their cost of revenue over the past decade. From 2014 to 2023, AMETEK, Inc. has seen a steady increase, with costs rising by approximately 62% from 2014 to 2023. This upward trend reflects AMETEK's expansion and increased production capabilities. In contrast, Graco Inc. has experienced a more modest growth of around 87% over the same period, indicating a stable yet progressive approach to managing production costs. Notably, 2022 marked a peak year for both companies, with AMETEK reaching its highest cost of revenue, while Graco Inc. also saw significant growth. However, data for AMETEK in 2024 is missing, leaving room for speculation on future trends. These insights provide a fascinating glimpse into the operational strategies of two industrial giants.
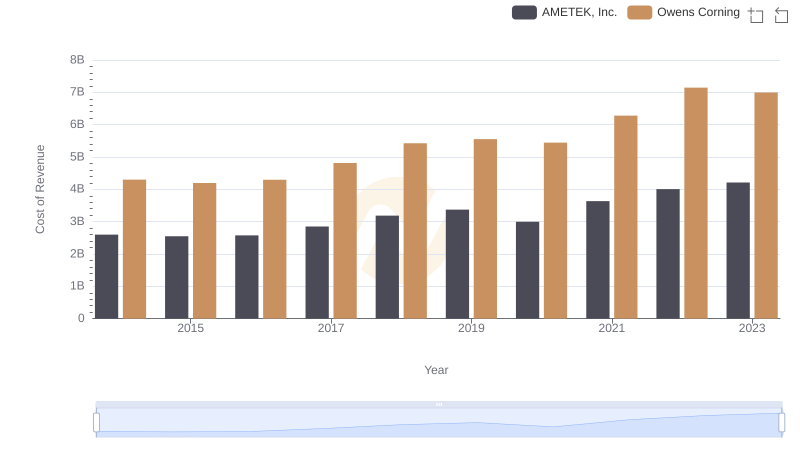
Cost of Revenue Trends: AMETEK, Inc. vs Owens Corning
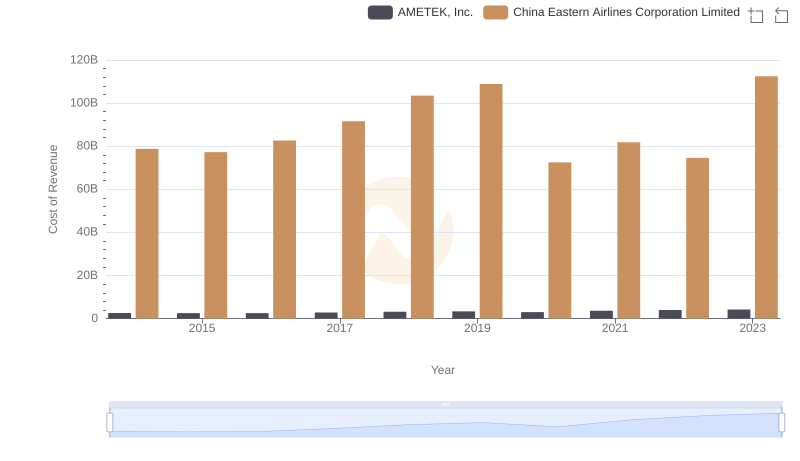
Comparing Cost of Revenue Efficiency: AMETEK, Inc. vs China Eastern Airlines Corporation Limited
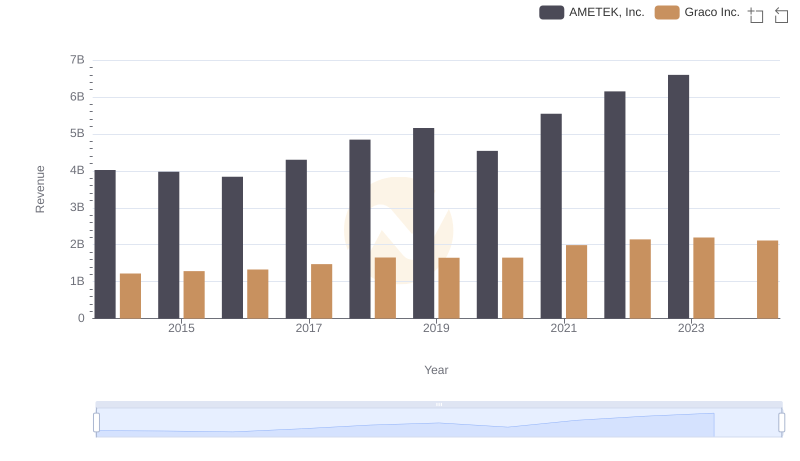
Annual Revenue Comparison: AMETEK, Inc. vs Graco Inc.
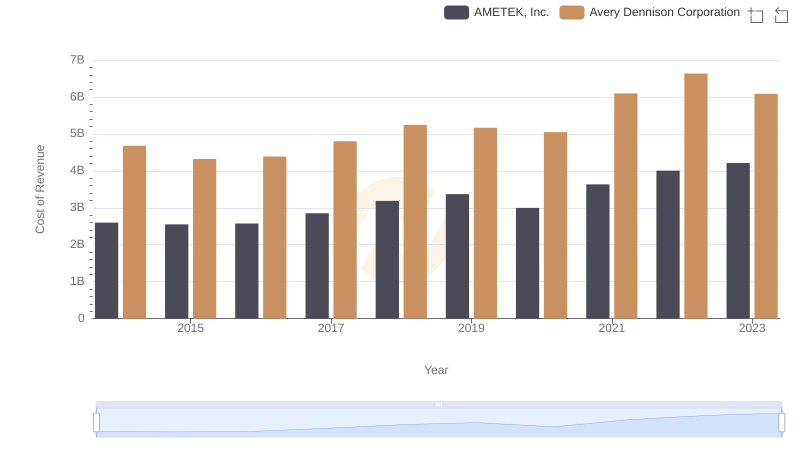
AMETEK, Inc. vs Avery Dennison Corporation: Efficiency in Cost of Revenue Explored
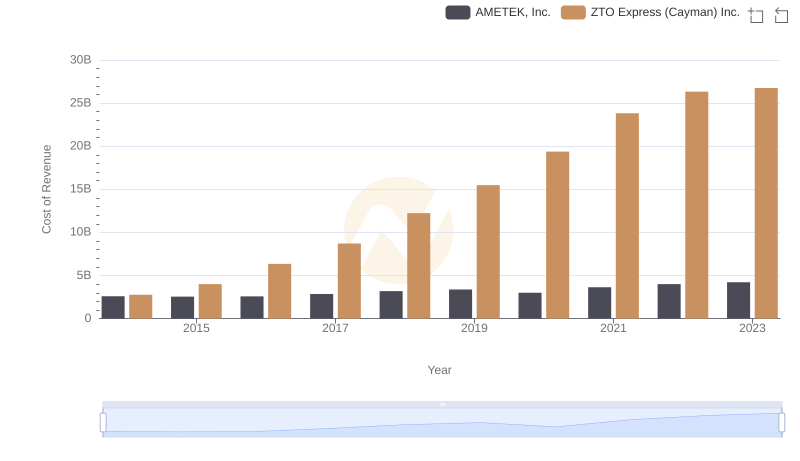
Cost Insights: Breaking Down AMETEK, Inc. and ZTO Express (Cayman) Inc.'s Expenses
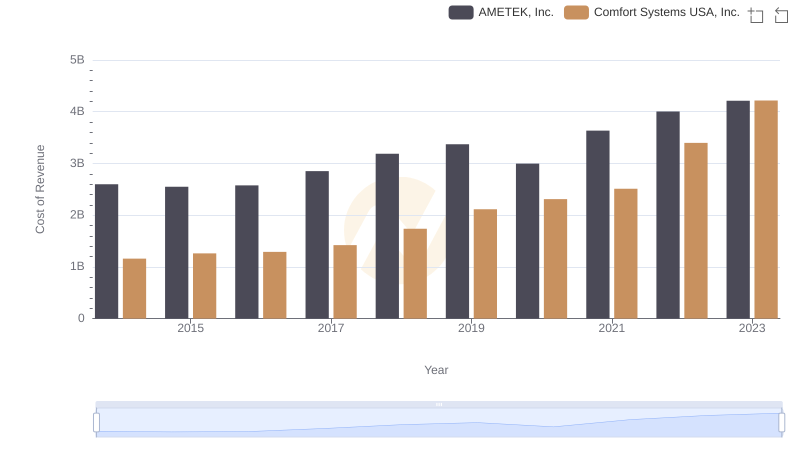
Cost of Revenue Comparison: AMETEK, Inc. vs Comfort Systems USA, Inc.
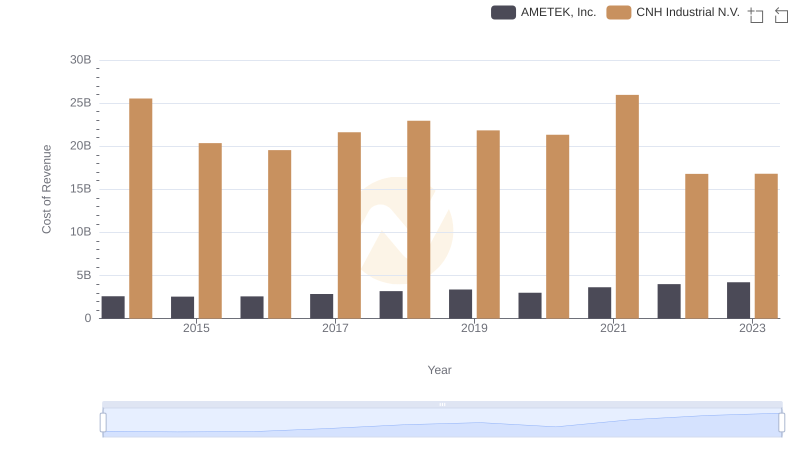
Cost Insights: Breaking Down AMETEK, Inc. and CNH Industrial N.V.'s Expenses
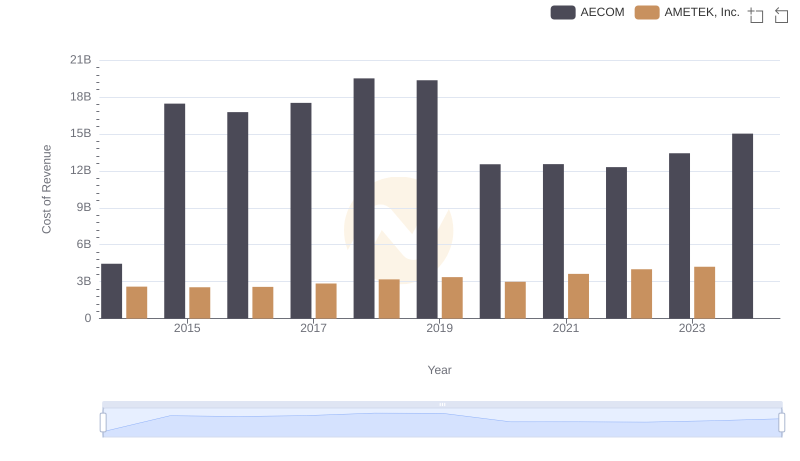
Cost of Revenue: Key Insights for AMETEK, Inc. and AECOM
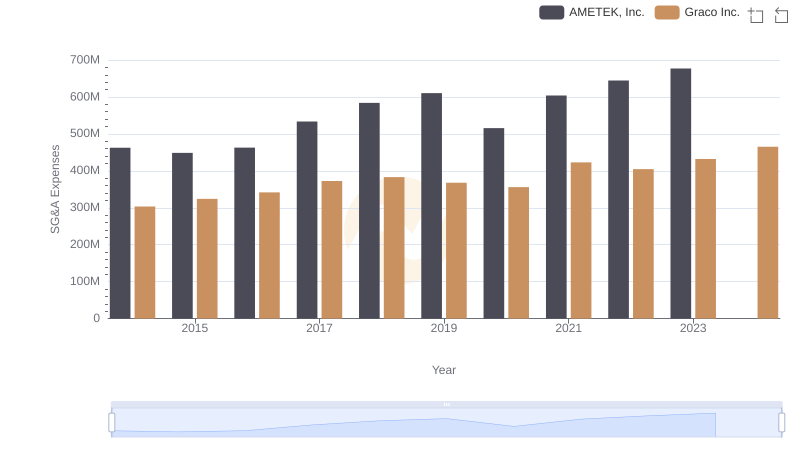
AMETEK, Inc. or Graco Inc.: Who Manages SG&A Costs Better?
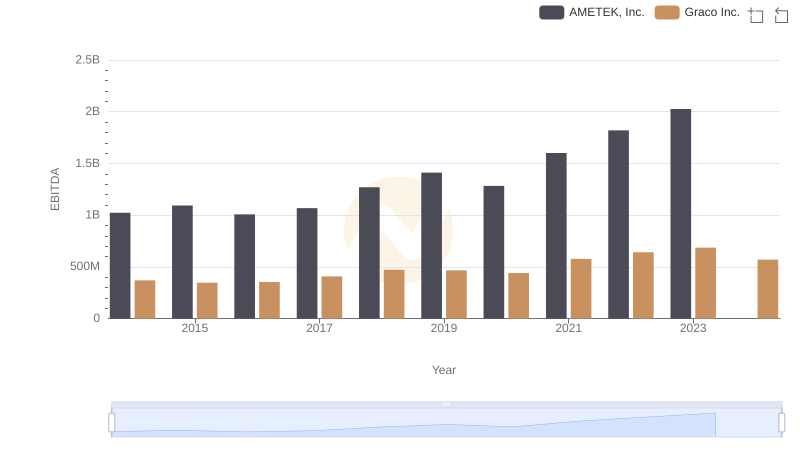
AMETEK, Inc. and Graco Inc.: A Detailed Examination of EBITDA Performance