| __timestamp | AMETEK, Inc. | Owens Corning |
|---|---|---|
| Wednesday, January 1, 2014 | 4021964000 | 5276000000 |
| Thursday, January 1, 2015 | 3974295000 | 5350000000 |
| Friday, January 1, 2016 | 3840087000 | 5677000000 |
| Sunday, January 1, 2017 | 4300170000 | 6384000000 |
| Monday, January 1, 2018 | 4845872000 | 7057000000 |
| Tuesday, January 1, 2019 | 5158557000 | 7160000000 |
| Wednesday, January 1, 2020 | 4540029000 | 7055000000 |
| Friday, January 1, 2021 | 5546514000 | 8498000000 |
| Saturday, January 1, 2022 | 6150530000 | 9761000000 |
| Sunday, January 1, 2023 | 6596950000 | 9677000000 |
| Monday, January 1, 2024 | 6941180000 |
Unleashing insights
In the competitive landscape of industrial manufacturing, AMETEK, Inc. and Owens Corning have been vying for the top spot in yearly revenue since 2014. Over the past decade, Owens Corning has consistently outpaced AMETEK, Inc., boasting a revenue lead of approximately 47% on average. In 2023, Owens Corning reported a revenue of nearly $9.7 billion, maintaining its dominance with a 47% higher revenue than AMETEK, Inc., which recorded $6.6 billion.
Despite AMETEK, Inc.'s impressive growth, with a 64% increase in revenue from 2014 to 2023, Owens Corning's strategic expansions and market adaptability have kept it ahead. This ongoing rivalry highlights the dynamic nature of the industrial sector, where innovation and strategic foresight are key to maintaining a competitive edge.
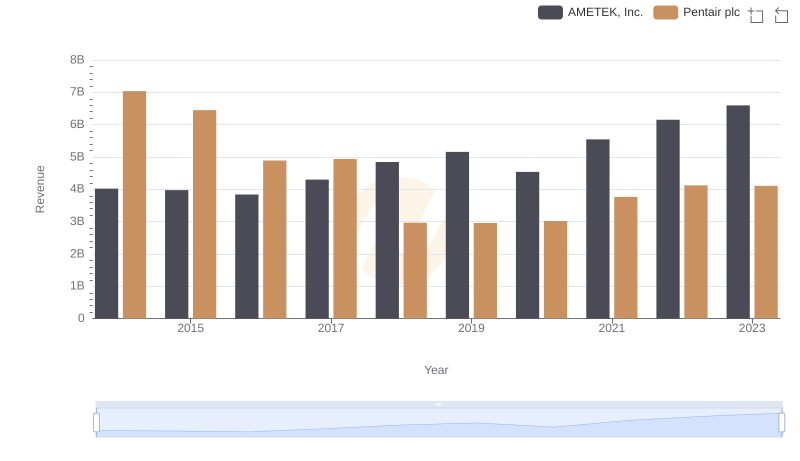
AMETEK, Inc. vs Pentair plc: Annual Revenue Growth Compared
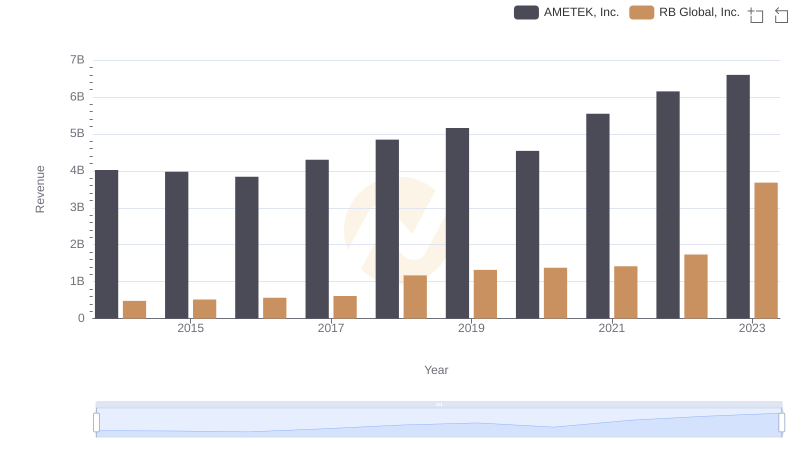
AMETEK, Inc. and RB Global, Inc.: A Comprehensive Revenue Analysis
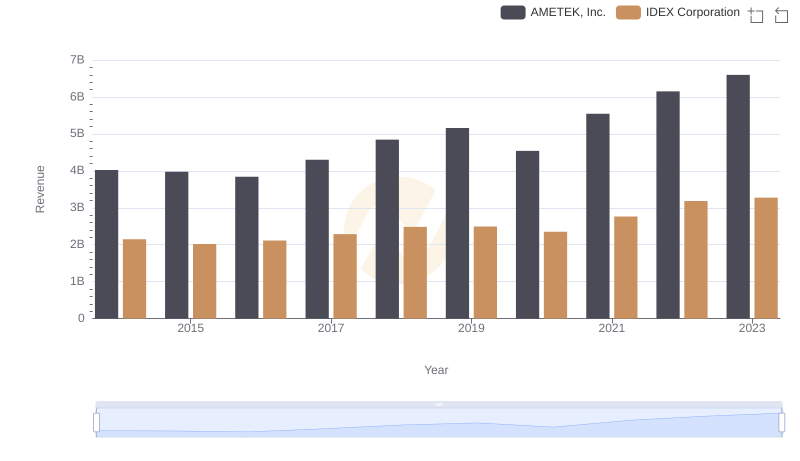
Who Generates More Revenue? AMETEK, Inc. or IDEX Corporation
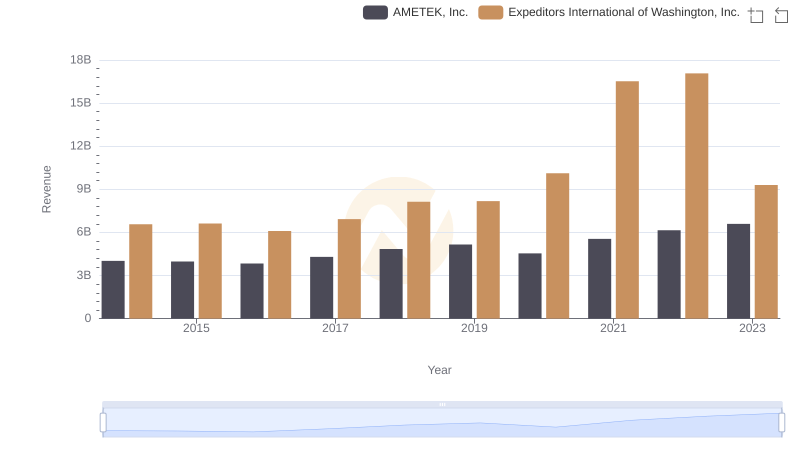
AMETEK, Inc. and Expeditors International of Washington, Inc.: A Comprehensive Revenue Analysis
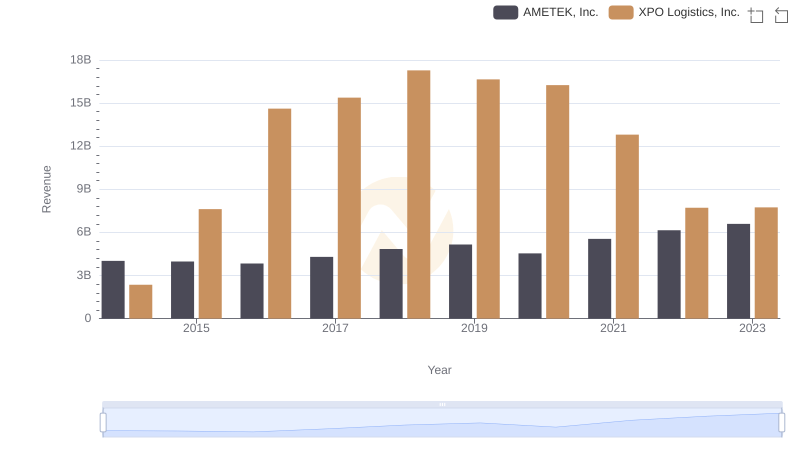
Who Generates More Revenue? AMETEK, Inc. or XPO Logistics, Inc.
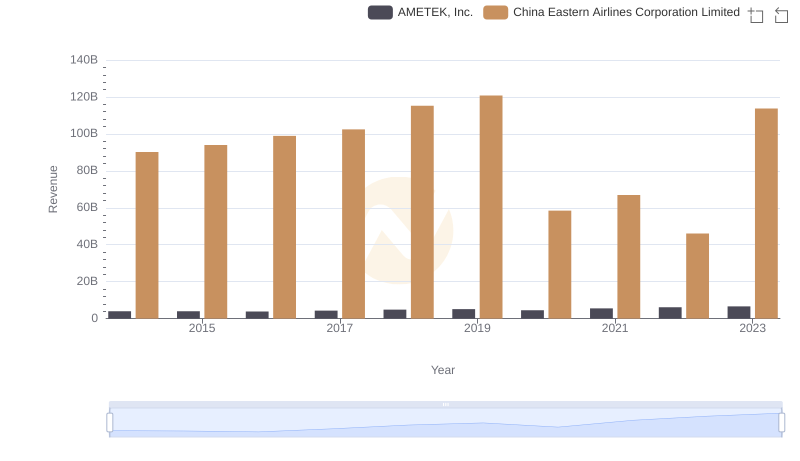
AMETEK, Inc. or China Eastern Airlines Corporation Limited: Who Leads in Yearly Revenue?
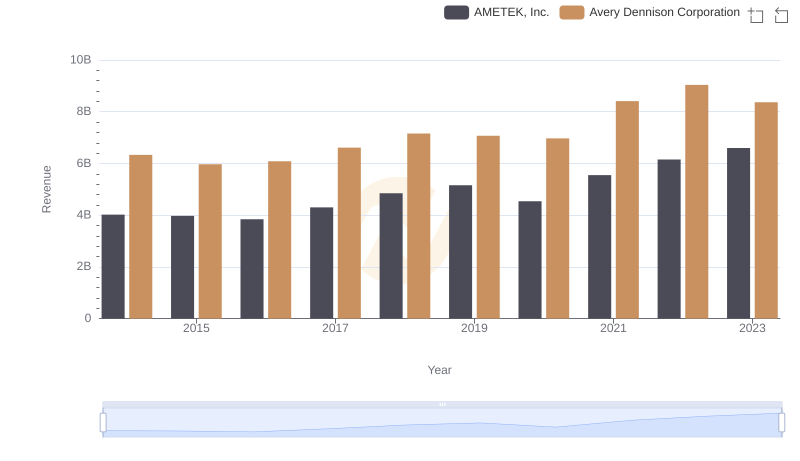
Breaking Down Revenue Trends: AMETEK, Inc. vs Avery Dennison Corporation
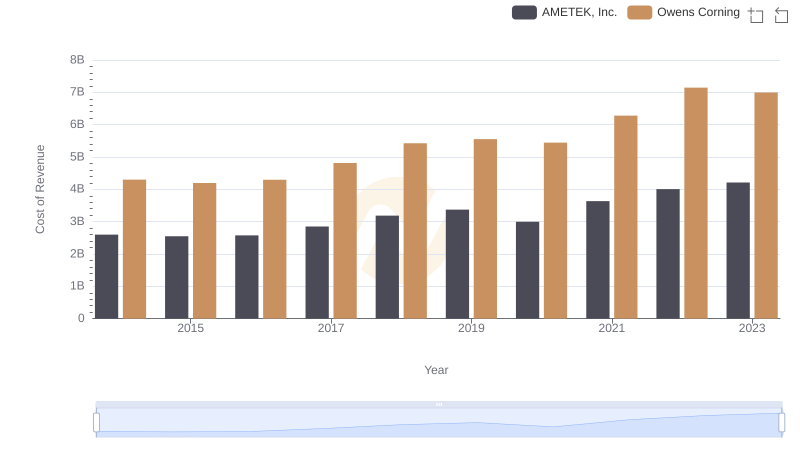
Cost of Revenue Trends: AMETEK, Inc. vs Owens Corning
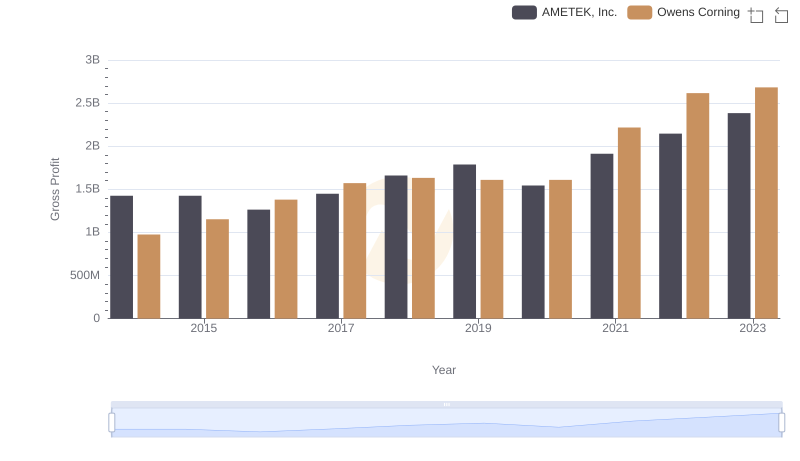
Who Generates Higher Gross Profit? AMETEK, Inc. or Owens Corning
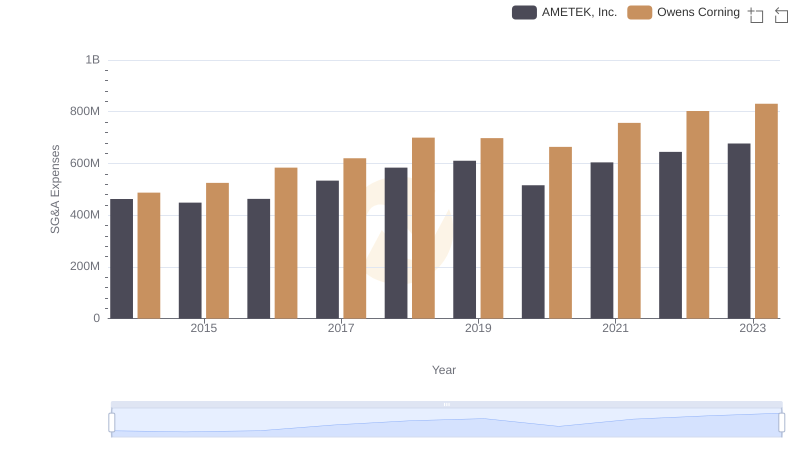
Comparing SG&A Expenses: AMETEK, Inc. vs Owens Corning Trends and Insights
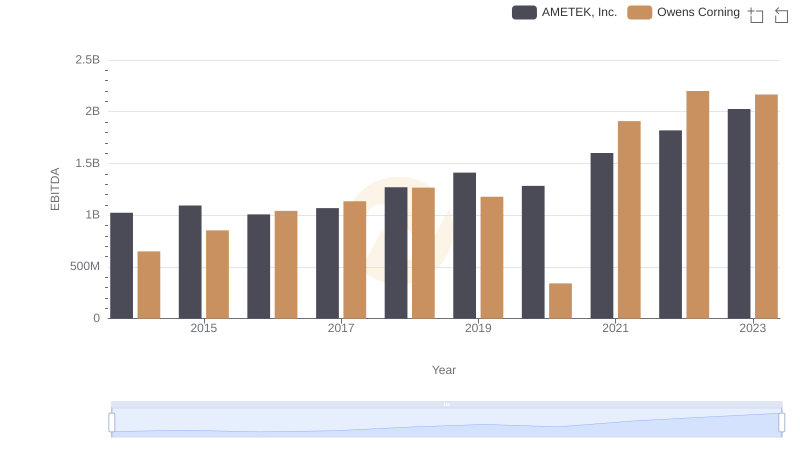
EBITDA Performance Review: AMETEK, Inc. vs Owens Corning