| __timestamp | AMETEK, Inc. | Expeditors International of Washington, Inc. |
|---|---|---|
| Wednesday, January 1, 2014 | 2597017000 | 5800725000 |
| Thursday, January 1, 2015 | 2549280000 | 5720848000 |
| Friday, January 1, 2016 | 2575220000 | 5247244000 |
| Sunday, January 1, 2017 | 2851431000 | 6037921000 |
| Monday, January 1, 2018 | 3186310000 | 7118083000 |
| Tuesday, January 1, 2019 | 3370897000 | 7178405000 |
| Wednesday, January 1, 2020 | 2996515000 | 8953716000 |
| Friday, January 1, 2021 | 3633900000 | 14358105000 |
| Saturday, January 1, 2022 | 4005261000 | 14900154000 |
| Sunday, January 1, 2023 | 4212484999 | 8054634000 |
| Monday, January 1, 2024 | 0 | 0 |
In pursuit of knowledge
In the ever-evolving landscape of global commerce, AMETEK, Inc. and Expeditors International of Washington, Inc. stand as titans in their respective fields. Over the past decade, these companies have showcased contrasting trajectories in their cost of revenue. From 2014 to 2023, AMETEK's cost of revenue has seen a steady climb, increasing by approximately 62%, reflecting its strategic investments and operational efficiencies. In contrast, Expeditors International experienced a dramatic surge, peaking in 2022 with a 156% increase from 2014, before a notable decline in 2023. This fluctuation highlights the volatile nature of the logistics industry, influenced by global supply chain disruptions and economic shifts. As we delve into these figures, it becomes evident that while both companies navigate different challenges, their financial strategies offer valuable insights into managing costs in dynamic markets.
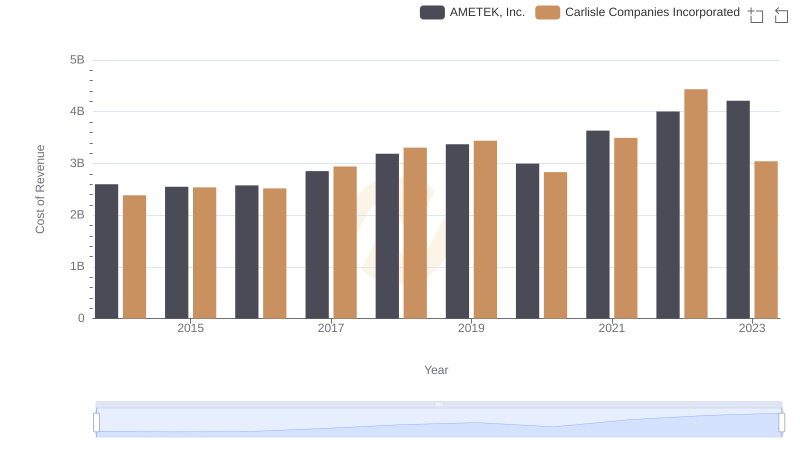
Cost of Revenue Comparison: AMETEK, Inc. vs Carlisle Companies Incorporated
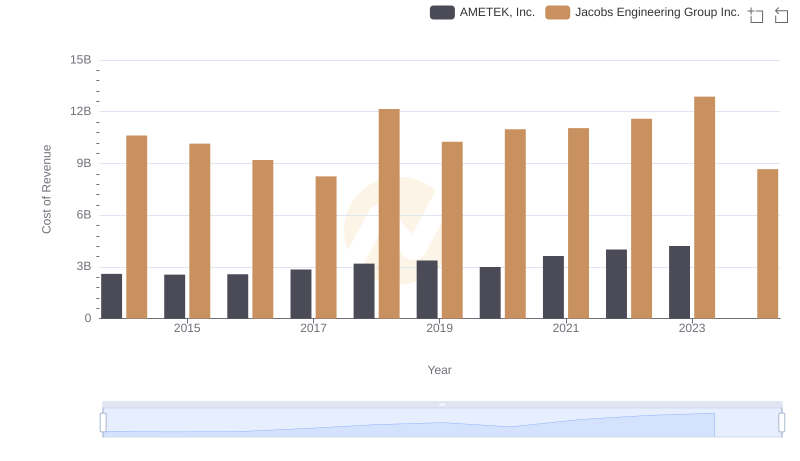
AMETEK, Inc. vs Jacobs Engineering Group Inc.: Efficiency in Cost of Revenue Explored
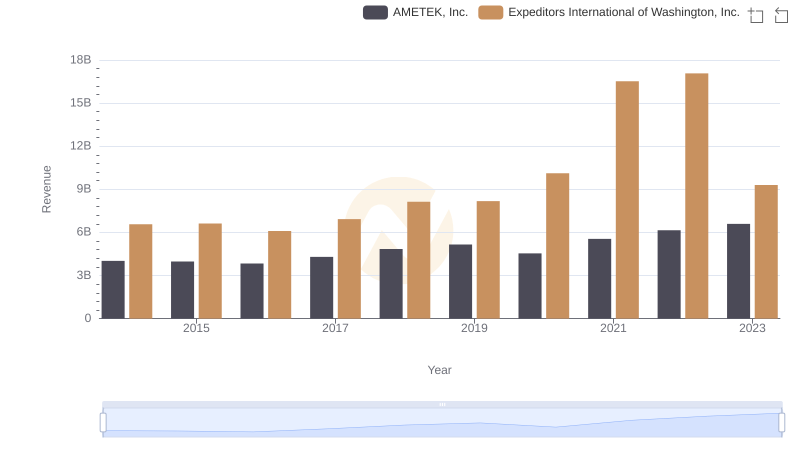
AMETEK, Inc. and Expeditors International of Washington, Inc.: A Comprehensive Revenue Analysis
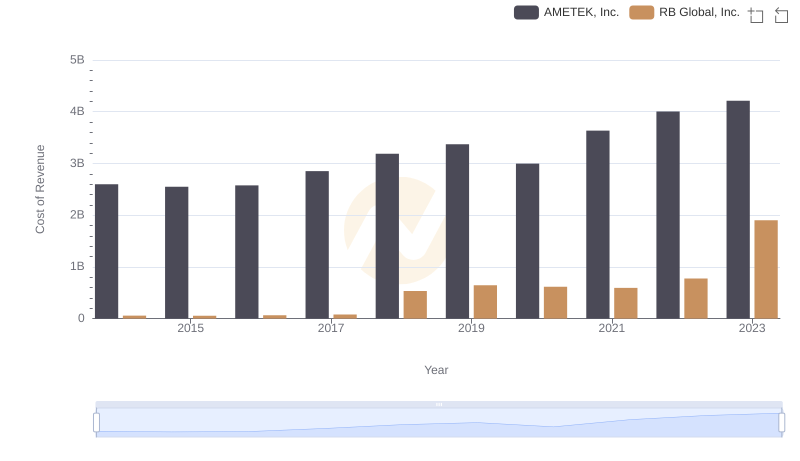
AMETEK, Inc. vs RB Global, Inc.: Efficiency in Cost of Revenue Explored
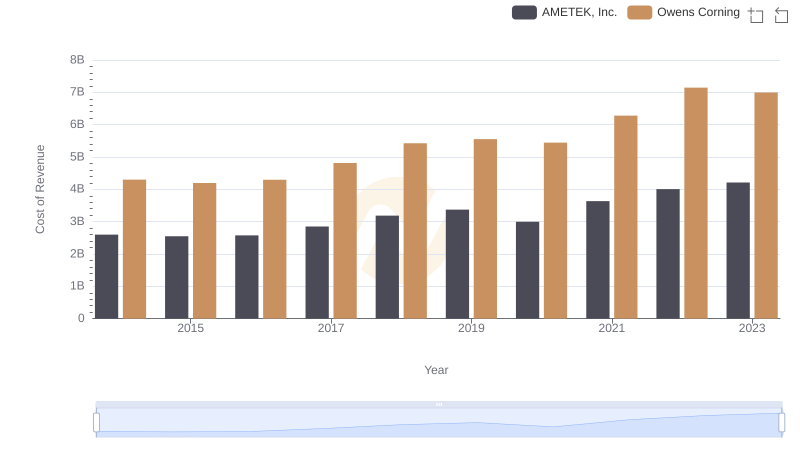
Cost of Revenue Trends: AMETEK, Inc. vs Owens Corning
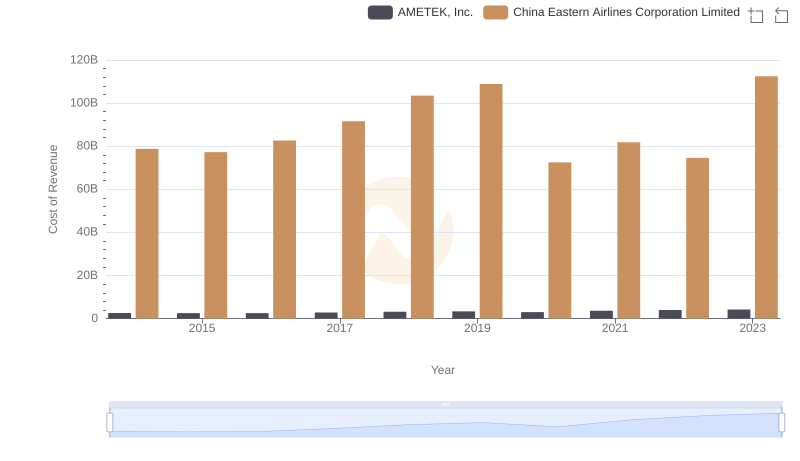
Comparing Cost of Revenue Efficiency: AMETEK, Inc. vs China Eastern Airlines Corporation Limited
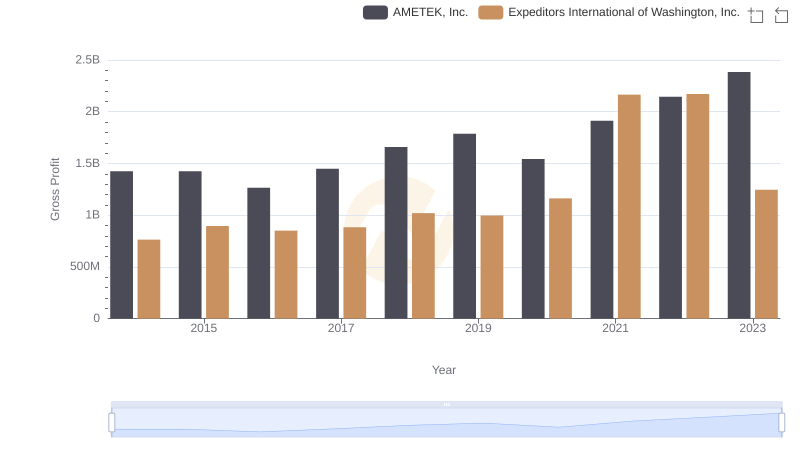
AMETEK, Inc. vs Expeditors International of Washington, Inc.: A Gross Profit Performance Breakdown
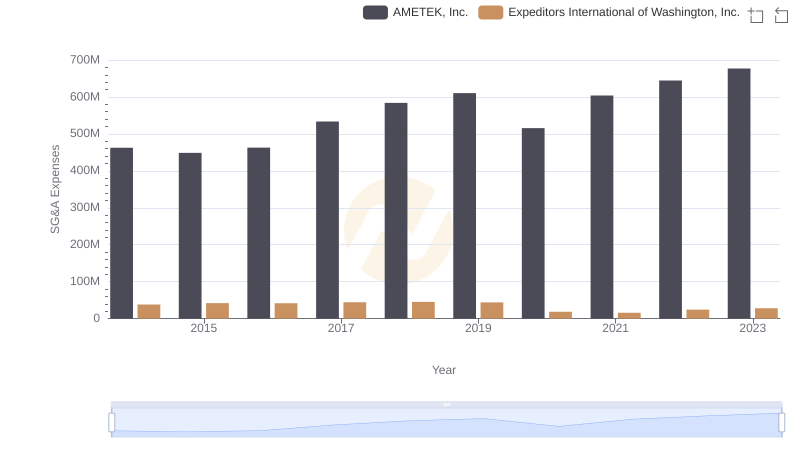
Operational Costs Compared: SG&A Analysis of AMETEK, Inc. and Expeditors International of Washington, Inc.
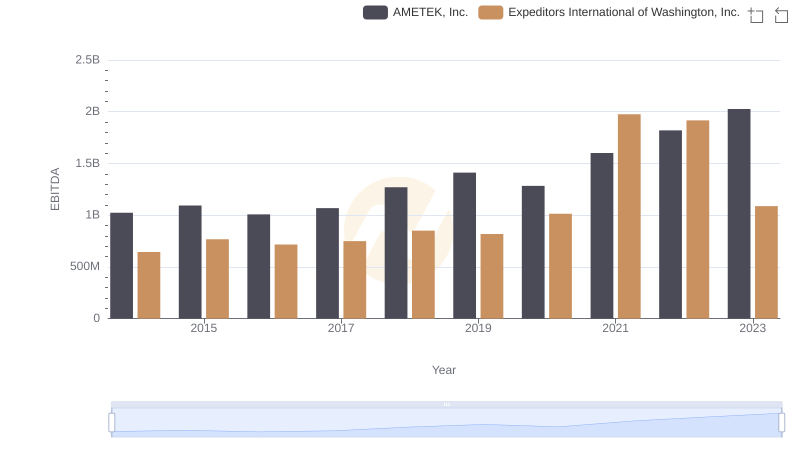
AMETEK, Inc. and Expeditors International of Washington, Inc.: A Detailed Examination of EBITDA Performance