| __timestamp | AMETEK, Inc. | Avery Dennison Corporation |
|---|---|---|
| Wednesday, January 1, 2014 | 2597017000 | 4679100000 |
| Thursday, January 1, 2015 | 2549280000 | 4321100000 |
| Friday, January 1, 2016 | 2575220000 | 4386800000 |
| Sunday, January 1, 2017 | 2851431000 | 4801600000 |
| Monday, January 1, 2018 | 3186310000 | 5243500000 |
| Tuesday, January 1, 2019 | 3370897000 | 5166000000 |
| Wednesday, January 1, 2020 | 2996515000 | 5048200000 |
| Friday, January 1, 2021 | 3633900000 | 6095500000 |
| Saturday, January 1, 2022 | 4005261000 | 6635100000 |
| Sunday, January 1, 2023 | 4212484999 | 6086800000 |
| Monday, January 1, 2024 | 0 | 6225000000 |
Unleashing the power of data
In the ever-evolving landscape of industrial manufacturing, cost efficiency remains a pivotal factor for success. This analysis delves into the cost of revenue trends for AMETEK, Inc. and Avery Dennison Corporation from 2014 to 2023. Over this decade, AMETEK, Inc. demonstrated a steady increase in cost efficiency, with a notable 62% rise in cost of revenue, peaking at $4.2 billion in 2023. Meanwhile, Avery Dennison Corporation experienced a 41% increase, reaching its zenith at $6.6 billion in 2022 before a slight dip in 2023.
The data reveals that while both companies have shown growth, AMETEK, Inc. has managed a more consistent upward trajectory. This insight into cost management strategies offers a valuable perspective for investors and industry analysts alike, highlighting the importance of strategic financial planning in maintaining competitive advantage.
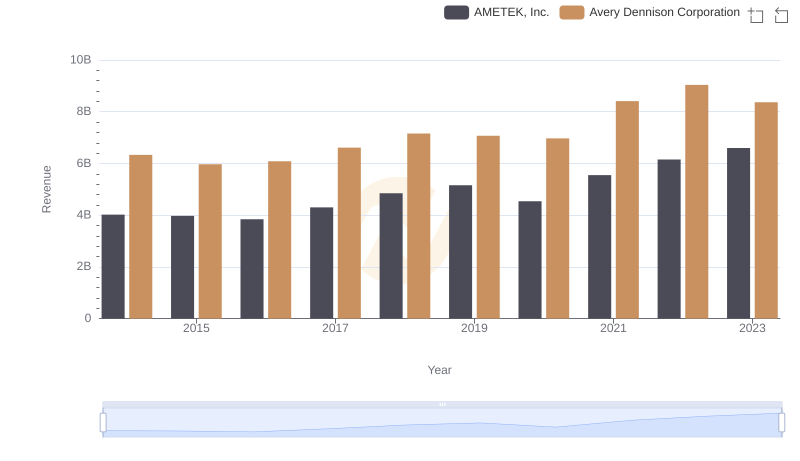
Breaking Down Revenue Trends: AMETEK, Inc. vs Avery Dennison Corporation
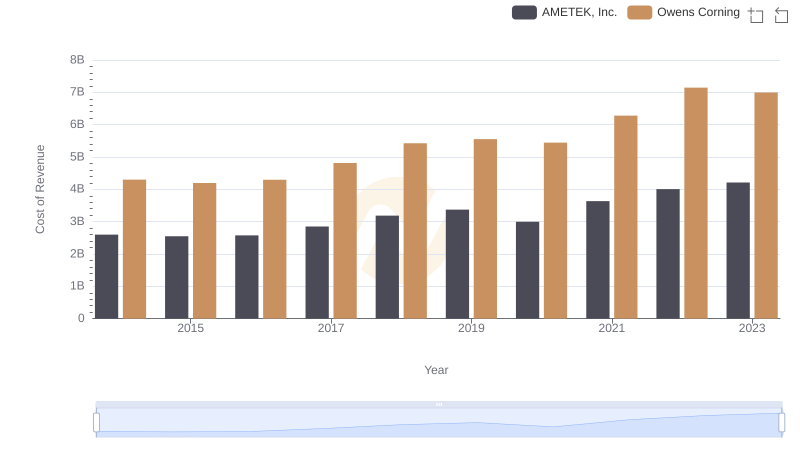
Cost of Revenue Trends: AMETEK, Inc. vs Owens Corning
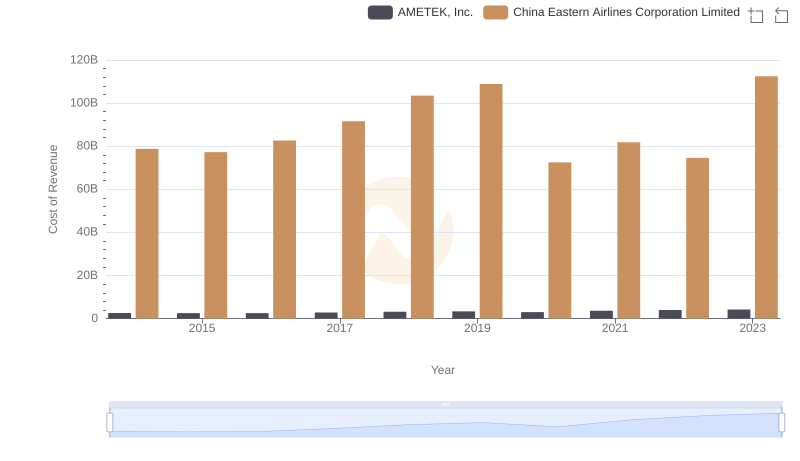
Comparing Cost of Revenue Efficiency: AMETEK, Inc. vs China Eastern Airlines Corporation Limited
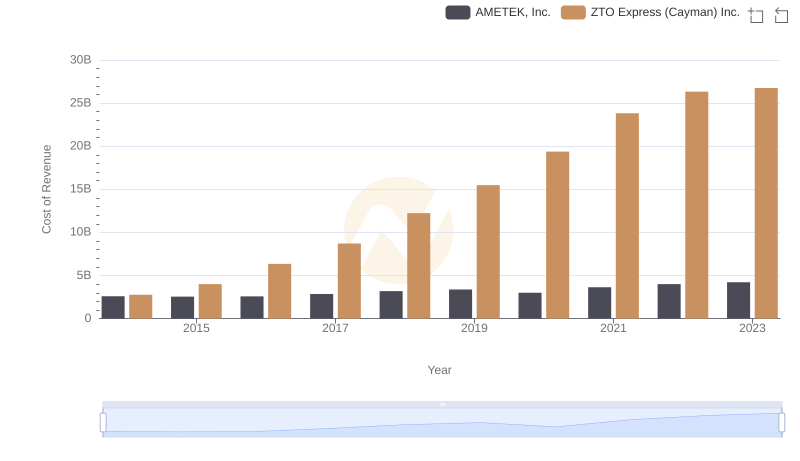
Cost Insights: Breaking Down AMETEK, Inc. and ZTO Express (Cayman) Inc.'s Expenses
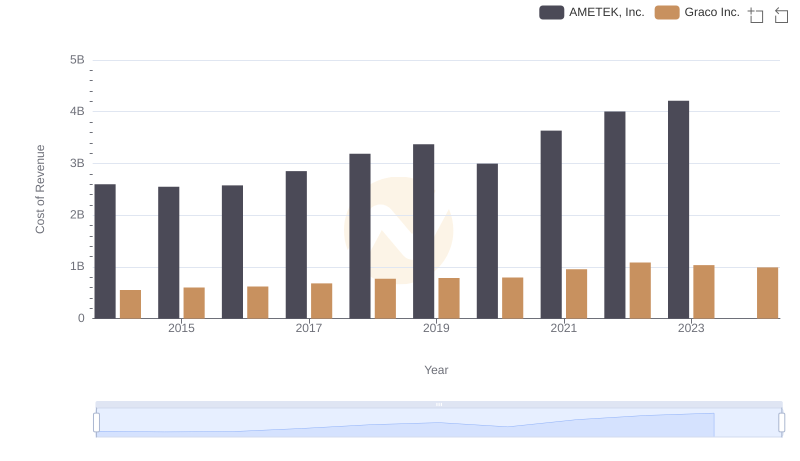
Cost of Revenue Trends: AMETEK, Inc. vs Graco Inc.
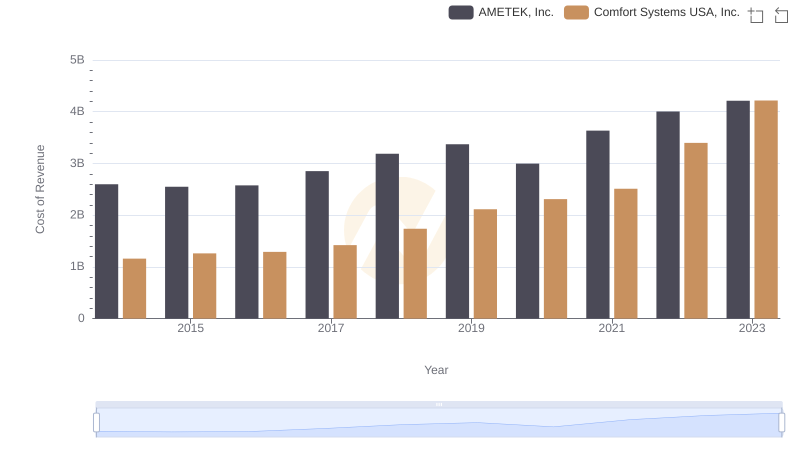
Cost of Revenue Comparison: AMETEK, Inc. vs Comfort Systems USA, Inc.
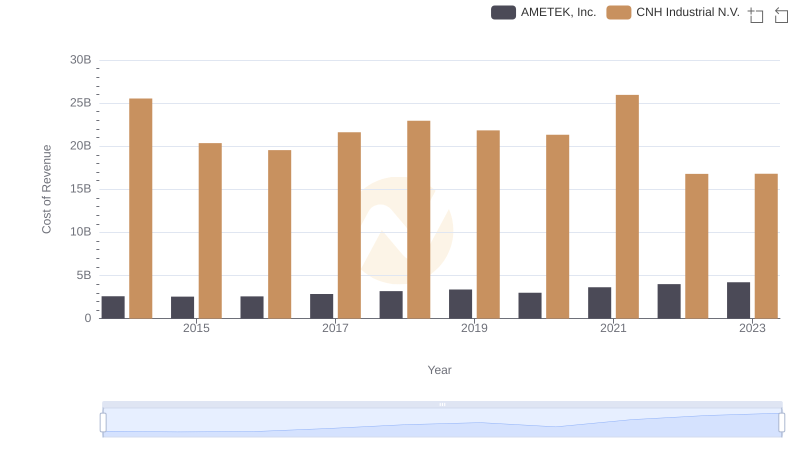
Cost Insights: Breaking Down AMETEK, Inc. and CNH Industrial N.V.'s Expenses
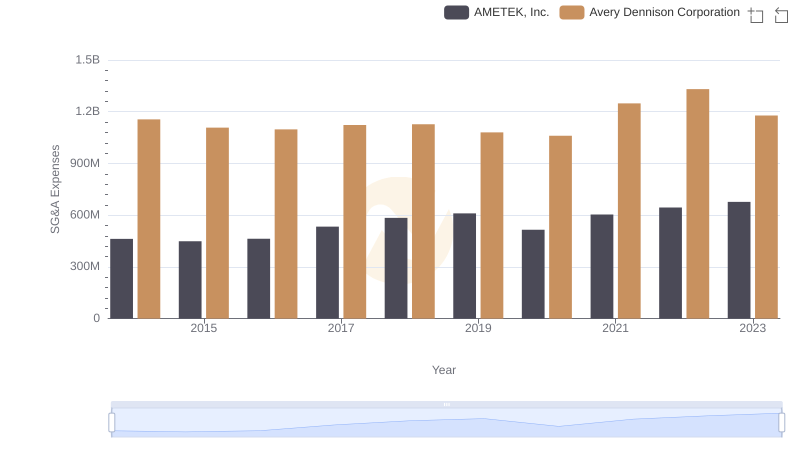
Cost Management Insights: SG&A Expenses for AMETEK, Inc. and Avery Dennison Corporation