| __timestamp | Graco Inc. | United Rentals, Inc. |
|---|---|---|
| Wednesday, January 1, 2014 | 554394000 | 3253000000 |
| Thursday, January 1, 2015 | 601785000 | 3337000000 |
| Friday, January 1, 2016 | 621054000 | 3359000000 |
| Sunday, January 1, 2017 | 681695000 | 3872000000 |
| Monday, January 1, 2018 | 770753000 | 4683000000 |
| Tuesday, January 1, 2019 | 786289000 | 5681000000 |
| Wednesday, January 1, 2020 | 795178000 | 5347000000 |
| Friday, January 1, 2021 | 953659000 | 5863000000 |
| Saturday, January 1, 2022 | 1086082000 | 6646000000 |
| Sunday, January 1, 2023 | 1034585000 | 8519000000 |
| Monday, January 1, 2024 | 990855000 | 9195000000 |
Cracking the code
In the dynamic world of industrial equipment, understanding cost structures is crucial. United Rentals, Inc. and Graco Inc., two industry titans, have shown distinct trends in their cost of revenue from 2014 to 2024. United Rentals, Inc. has seen a staggering 183% increase in its cost of revenue, peaking at approximately $9.2 billion in 2024. This growth reflects their aggressive expansion and market dominance. In contrast, Graco Inc. has experienced a more modest 79% rise, reaching around $1.0 billion in the same period. This steady growth underscores their strategic focus on efficiency and innovation.
While United Rentals, Inc. has consistently outpaced Graco Inc. in absolute terms, the latter's cost management strategies have kept their growth sustainable. This analysis highlights the diverse approaches companies take in navigating the competitive landscape of industrial equipment.
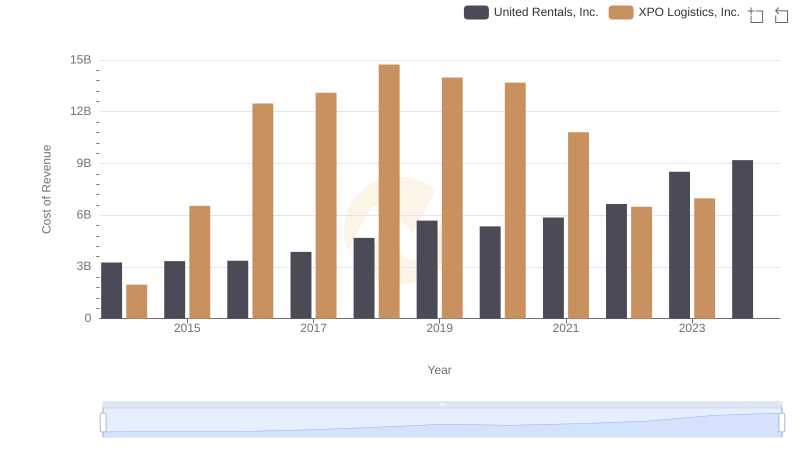
Cost of Revenue Trends: United Rentals, Inc. vs XPO Logistics, Inc.

Cost of Revenue: Key Insights for United Rentals, Inc. and Expeditors International of Washington, Inc.
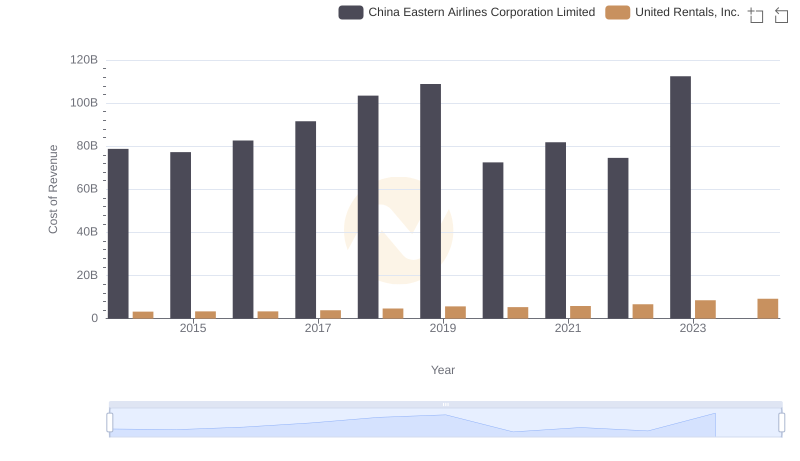
Cost of Revenue: Key Insights for United Rentals, Inc. and China Eastern Airlines Corporation Limited
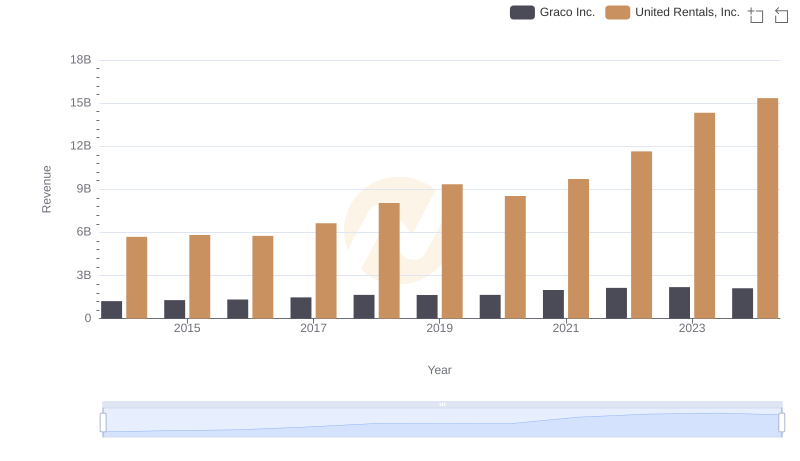
Who Generates More Revenue? United Rentals, Inc. or Graco Inc.
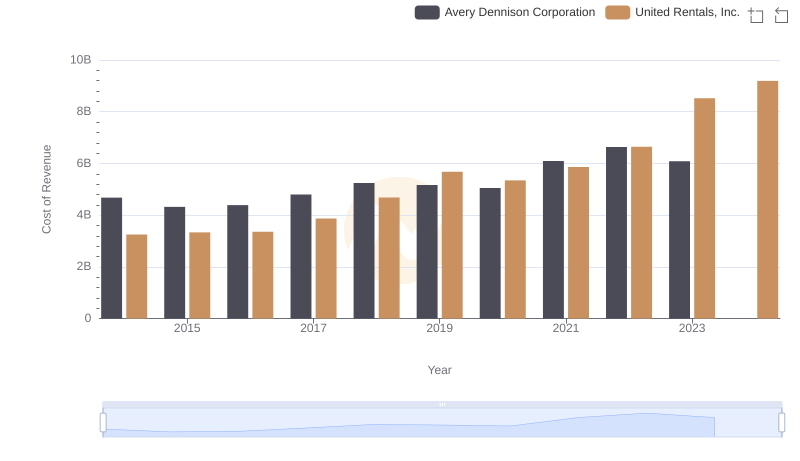
Analyzing Cost of Revenue: United Rentals, Inc. and Avery Dennison Corporation
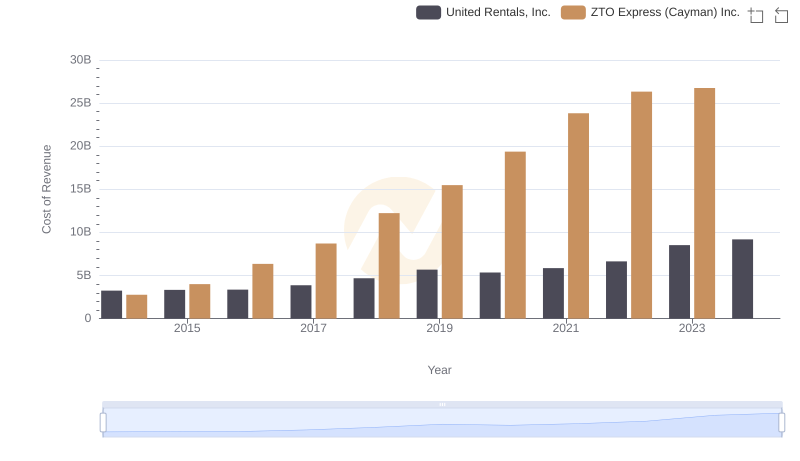
Comparing Cost of Revenue Efficiency: United Rentals, Inc. vs ZTO Express (Cayman) Inc.
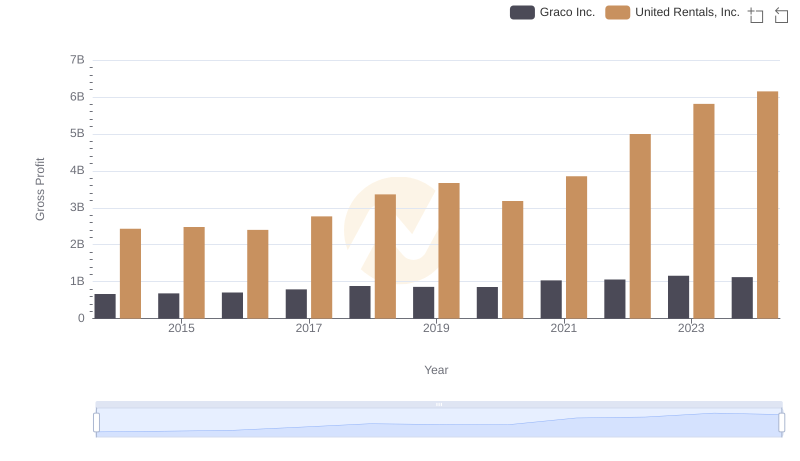
Gross Profit Comparison: United Rentals, Inc. and Graco Inc. Trends
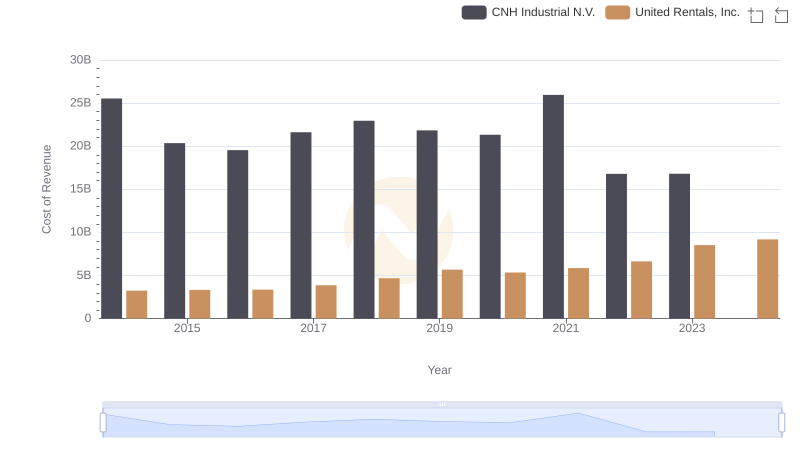
Comparing Cost of Revenue Efficiency: United Rentals, Inc. vs CNH Industrial N.V.
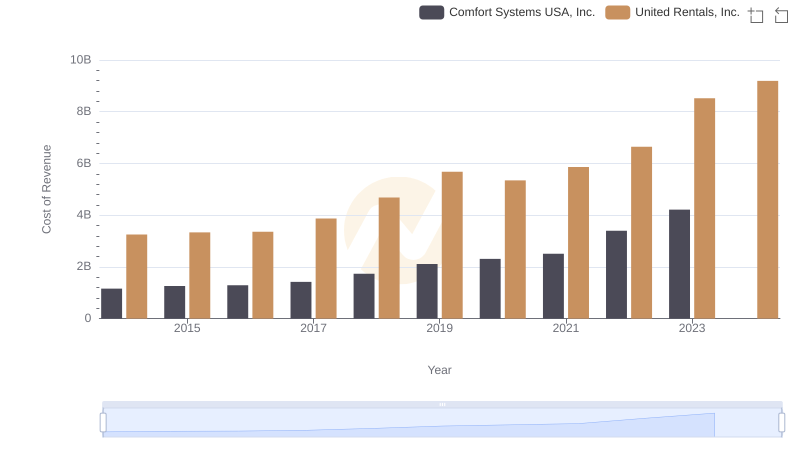
Cost of Revenue Trends: United Rentals, Inc. vs Comfort Systems USA, Inc.
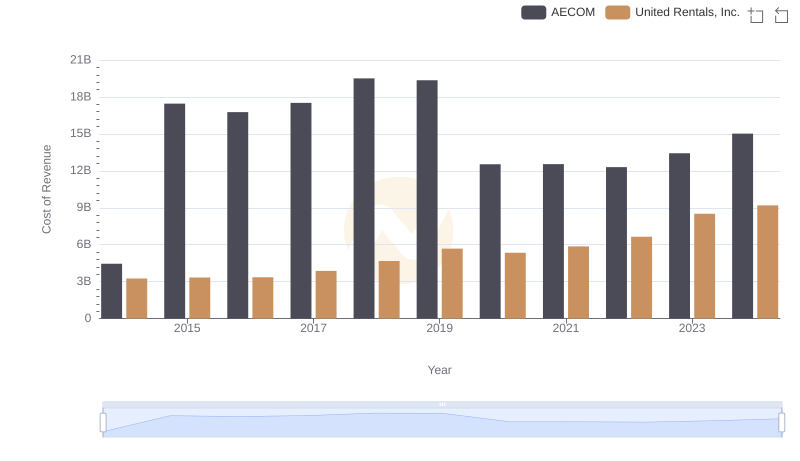
Cost of Revenue Comparison: United Rentals, Inc. vs AECOM
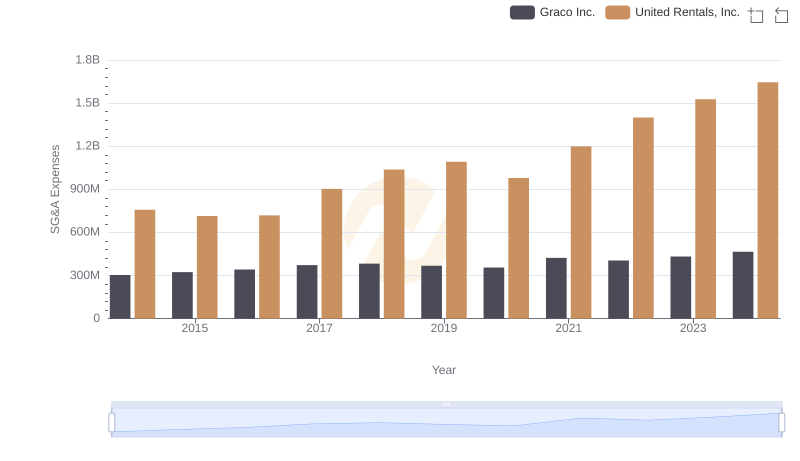
SG&A Efficiency Analysis: Comparing United Rentals, Inc. and Graco Inc.
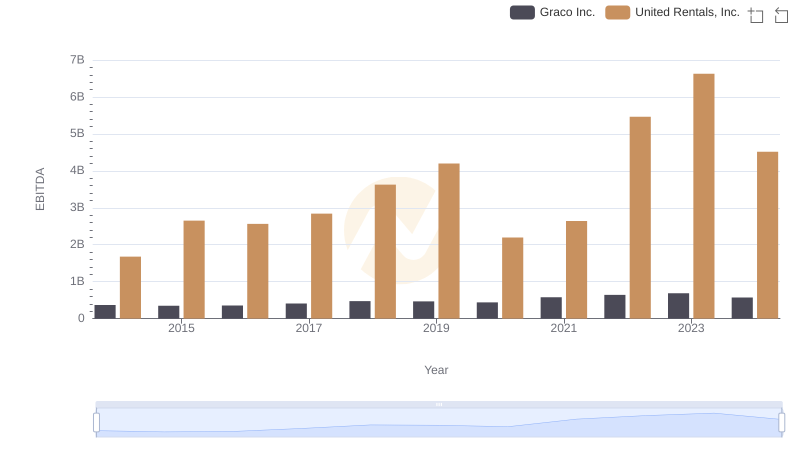
EBITDA Analysis: Evaluating United Rentals, Inc. Against Graco Inc.