| __timestamp | Applied Materials, Inc. | International Business Machines Corporation |
|---|---|---|
| Wednesday, January 1, 2014 | 5229000000 | 46386000000 |
| Thursday, January 1, 2015 | 5707000000 | 41057000000 |
| Friday, January 1, 2016 | 6314000000 | 41403000000 |
| Sunday, January 1, 2017 | 8005000000 | 42196000000 |
| Monday, January 1, 2018 | 9436000000 | 42655000000 |
| Tuesday, January 1, 2019 | 8222000000 | 26181000000 |
| Wednesday, January 1, 2020 | 9510000000 | 24314000000 |
| Friday, January 1, 2021 | 12149000000 | 25865000000 |
| Saturday, January 1, 2022 | 13792000000 | 27842000000 |
| Sunday, January 1, 2023 | 14133000000 | 27560000000 |
| Monday, January 1, 2024 | 14279000000 | 27202000000 |
In pursuit of knowledge
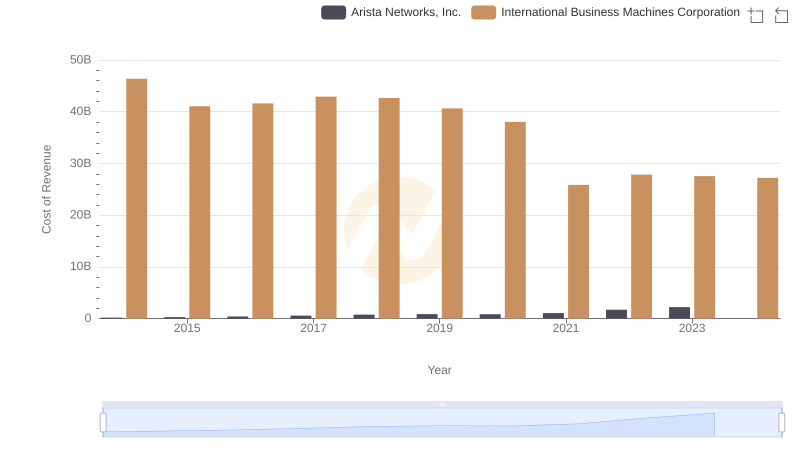
In the ever-evolving landscape of technology, understanding the cost of revenue is crucial for evaluating a company's financial health. This analysis focuses on two industry giants: International Business Machines Corporation (IBM) and Applied Materials, Inc. (AMAT).
From 2014 to 2024, IBM's cost of revenue has seen a significant decline, dropping from approximately $46 billion to $27 billion. This 41% reduction reflects IBM's strategic shift towards more efficient operations and a focus on high-margin services.
Conversely, Applied Materials has experienced a robust increase in its cost of revenue, rising from $5 billion in 2014 to $14 billion in 2024. This 180% surge underscores AMAT's expansion and increased production capacity to meet growing demand in the semiconductor industry.
While IBM is optimizing its operations, AMAT is scaling up, highlighting diverse strategies in the tech sector.
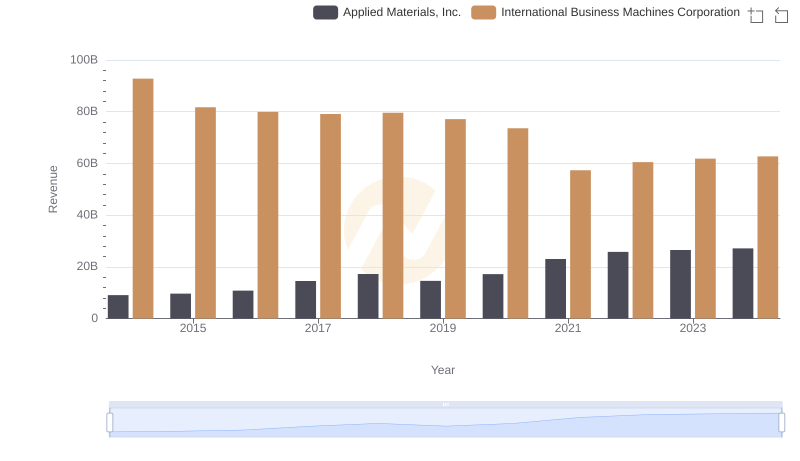
Comparing Revenue Performance: International Business Machines Corporation or Applied Materials, Inc.?
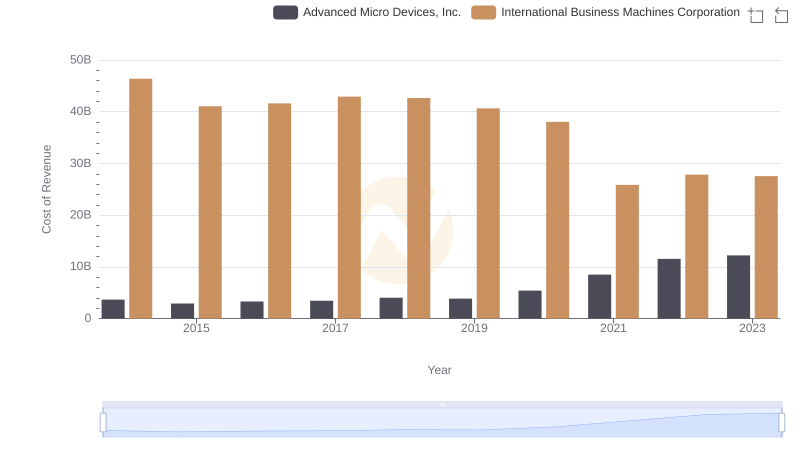
Cost of Revenue Trends: International Business Machines Corporation vs Advanced Micro Devices, Inc.
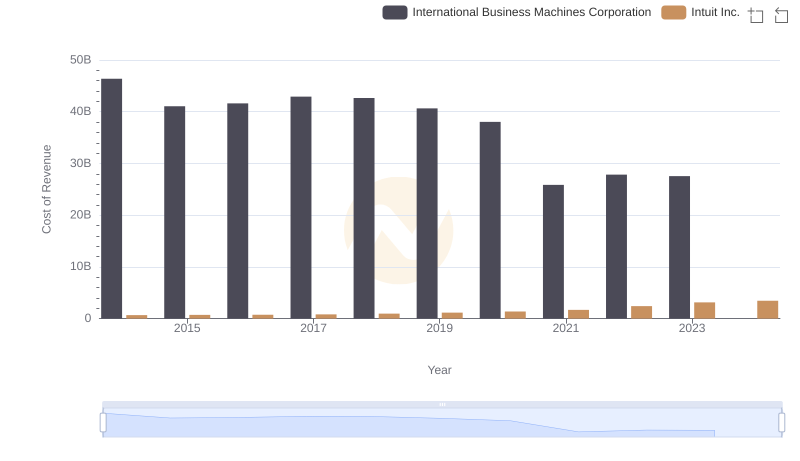
Cost of Revenue Comparison: International Business Machines Corporation vs Intuit Inc.
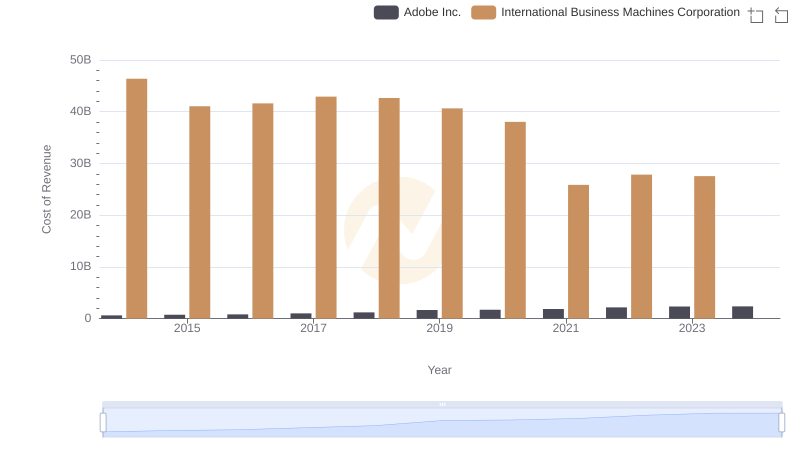
Cost of Revenue Trends: International Business Machines Corporation vs Adobe Inc.
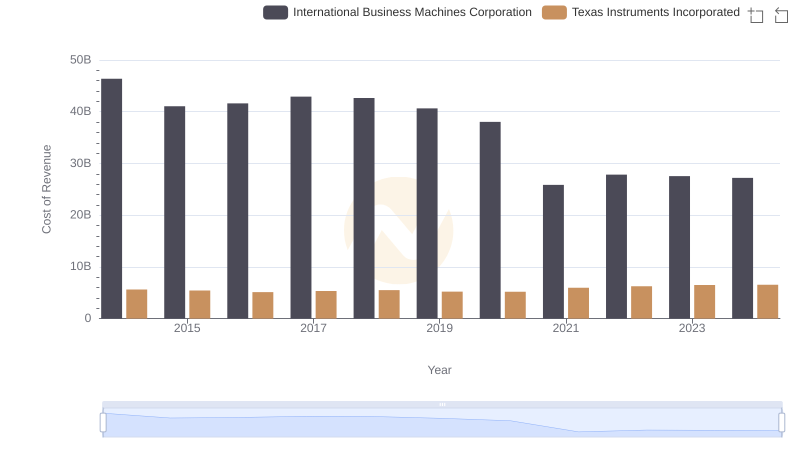
Cost Insights: Breaking Down International Business Machines Corporation and Texas Instruments Incorporated's Expenses
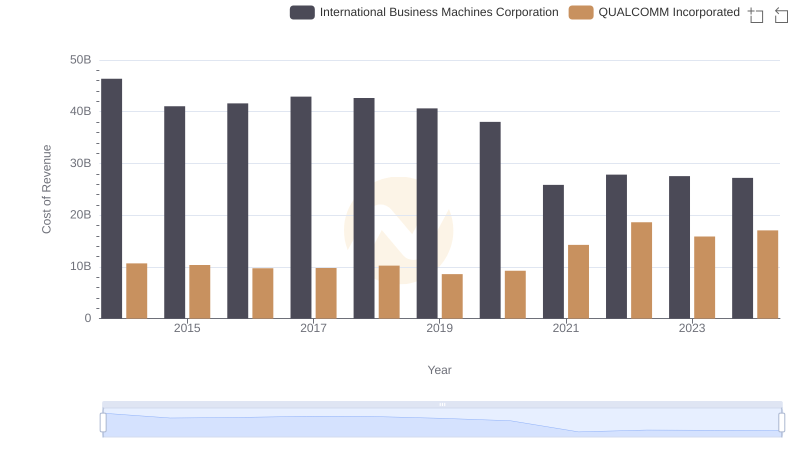
Cost of Revenue Comparison: International Business Machines Corporation vs QUALCOMM Incorporated
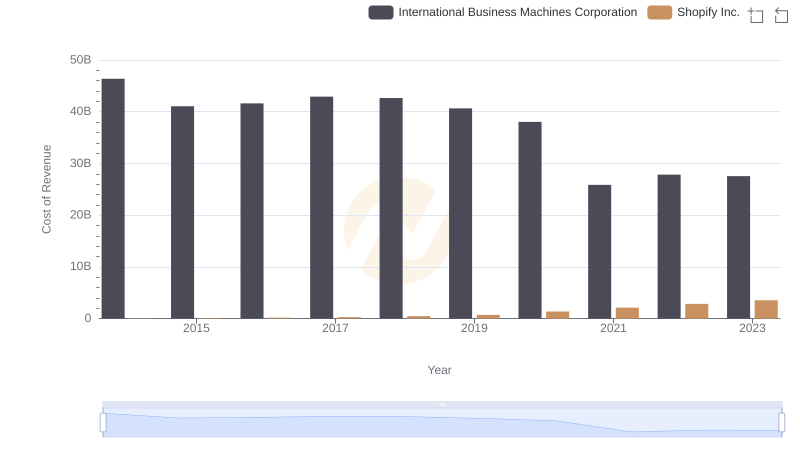
Analyzing Cost of Revenue: International Business Machines Corporation and Shopify Inc.
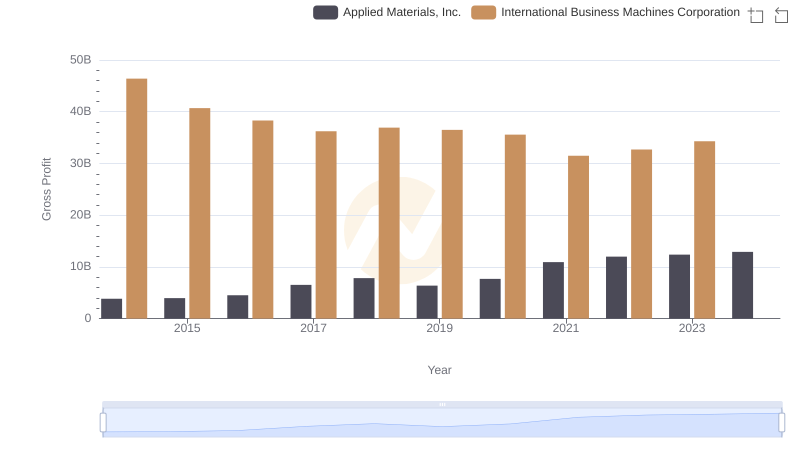
Gross Profit Analysis: Comparing International Business Machines Corporation and Applied Materials, Inc.
Analyzing Cost of Revenue: International Business Machines Corporation and Arista Networks, Inc.
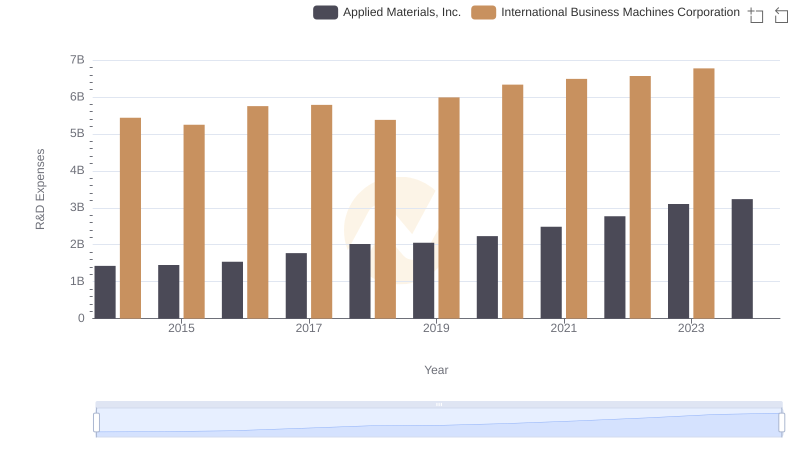
R&D Spending Showdown: International Business Machines Corporation vs Applied Materials, Inc.
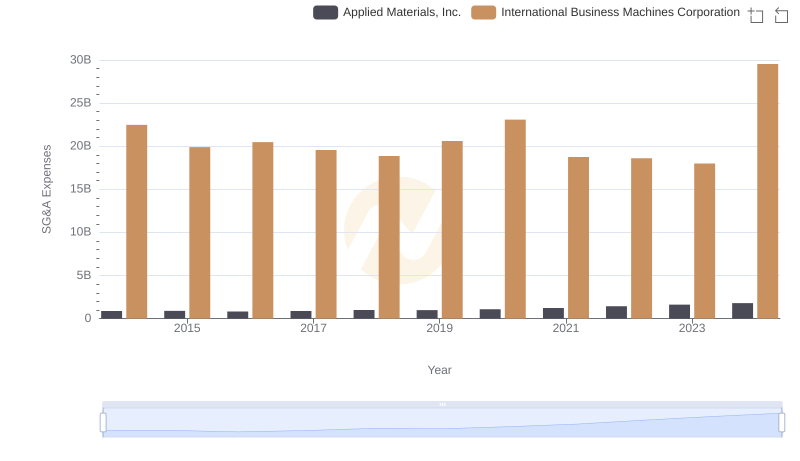
SG&A Efficiency Analysis: Comparing International Business Machines Corporation and Applied Materials, Inc.
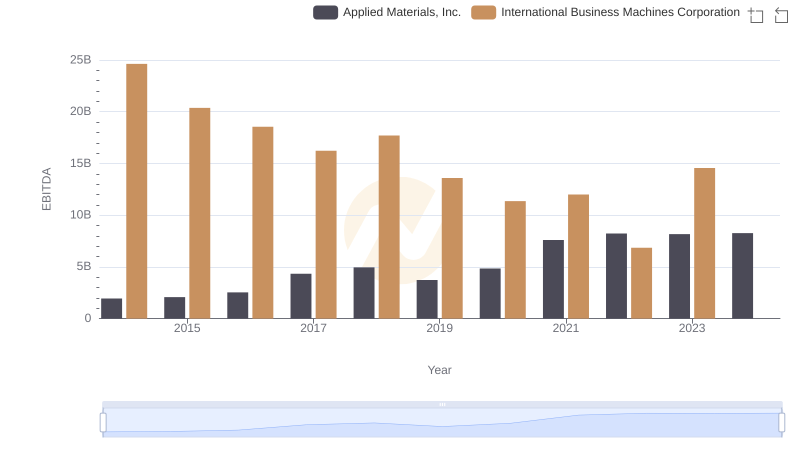
EBITDA Performance Review: International Business Machines Corporation vs Applied Materials, Inc.