| __timestamp | International Business Machines Corporation | Shopify Inc. |
|---|---|---|
| Wednesday, January 1, 2014 | 46386000000 | 43223000 |
| Thursday, January 1, 2015 | 41057000000 | 94162000 |
| Friday, January 1, 2016 | 41403000000 | 179835000 |
| Sunday, January 1, 2017 | 42196000000 | 293051000 |
| Monday, January 1, 2018 | 42655000000 | 476962000 |
| Tuesday, January 1, 2019 | 26181000000 | 712530000 |
| Wednesday, January 1, 2020 | 24314000000 | 1387971000 |
| Friday, January 1, 2021 | 25865000000 | 2130712000 |
| Saturday, January 1, 2022 | 27842000000 | 2845745000 |
| Sunday, January 1, 2023 | 27560000000 | 3545000000 |
| Monday, January 1, 2024 | 27202000000 | 4408000000 |
Cracking the code
In the ever-evolving landscape of technology and e-commerce, understanding the cost dynamics of industry giants like International Business Machines Corporation (IBM) and Shopify Inc. is crucial. Over the past decade, IBM's cost of revenue has seen a significant decline, dropping from approximately $46 billion in 2014 to around $27 billion in 2023. This represents a reduction of nearly 41%, reflecting IBM's strategic shift towards more efficient operations.
Conversely, Shopify's cost of revenue has surged, growing from a modest $43 million in 2014 to an impressive $3.5 billion in 2023. This exponential increase, over 8,000%, underscores Shopify's rapid expansion and scaling efforts in the e-commerce sector. The data for 2024 is incomplete, highlighting the dynamic nature of these industries. As IBM focuses on streamlining, Shopify's growth trajectory continues to reshape the digital commerce landscape.
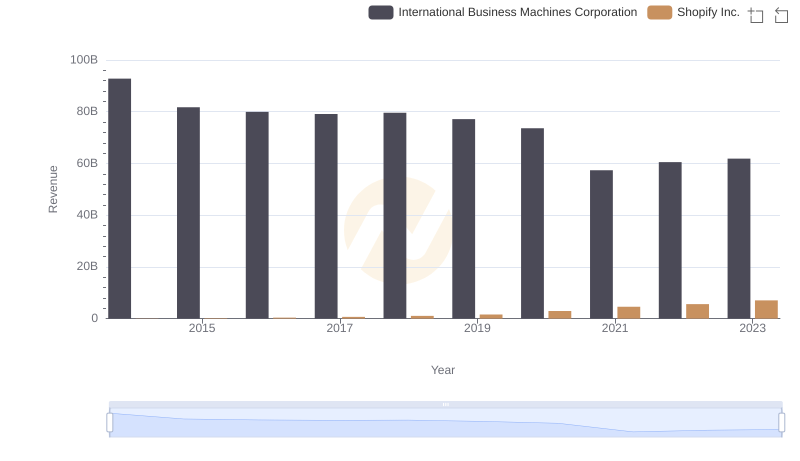
Comparing Revenue Performance: International Business Machines Corporation or Shopify Inc.?
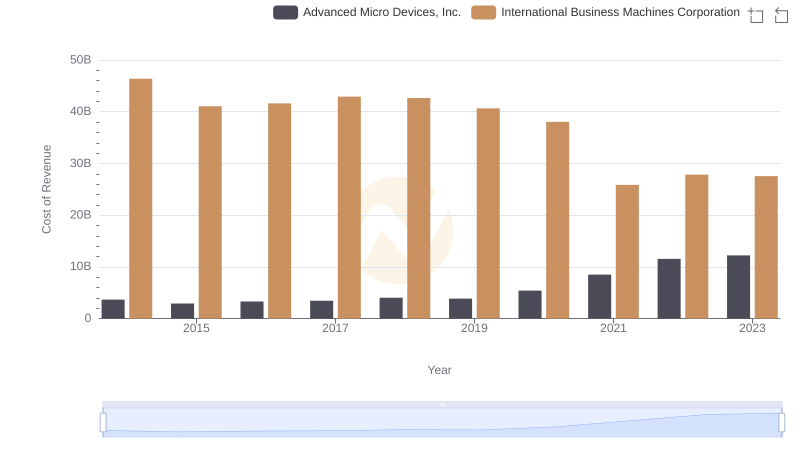
Cost of Revenue Trends: International Business Machines Corporation vs Advanced Micro Devices, Inc.
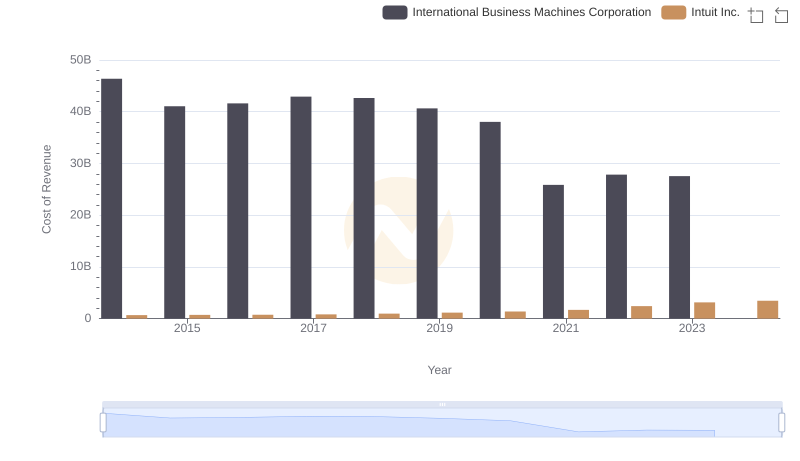
Cost of Revenue Comparison: International Business Machines Corporation vs Intuit Inc.
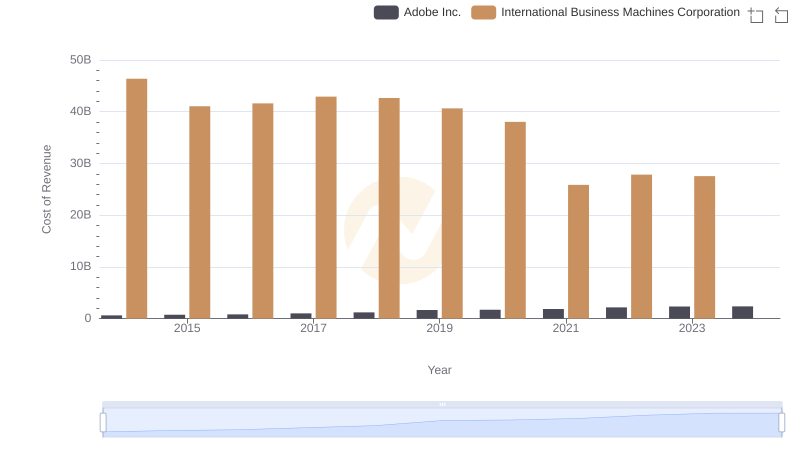
Cost of Revenue Trends: International Business Machines Corporation vs Adobe Inc.
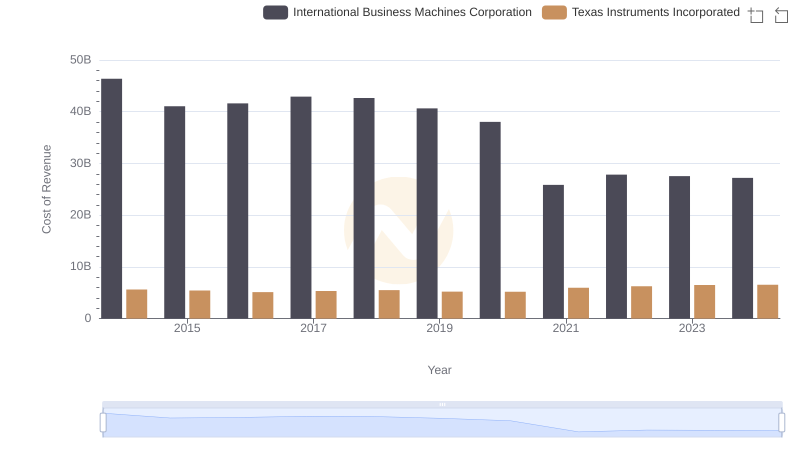
Cost Insights: Breaking Down International Business Machines Corporation and Texas Instruments Incorporated's Expenses
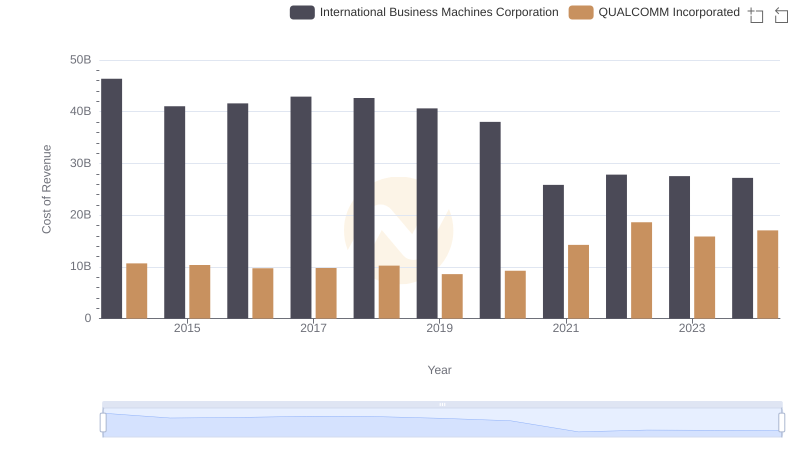
Cost of Revenue Comparison: International Business Machines Corporation vs QUALCOMM Incorporated
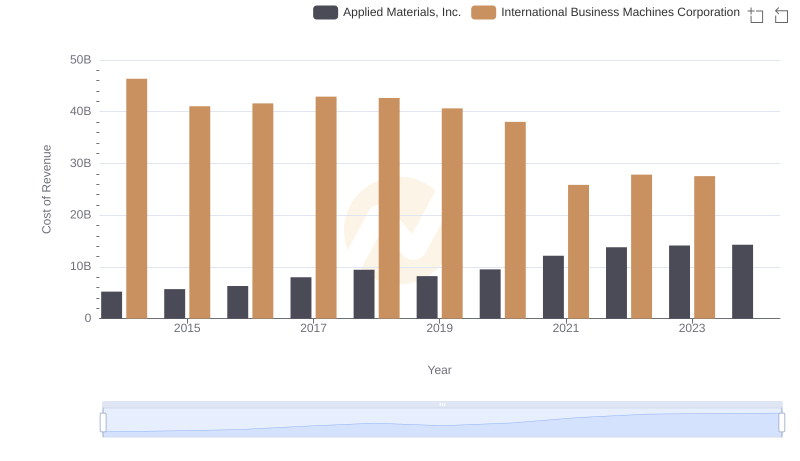
Cost of Revenue: Key Insights for International Business Machines Corporation and Applied Materials, Inc.
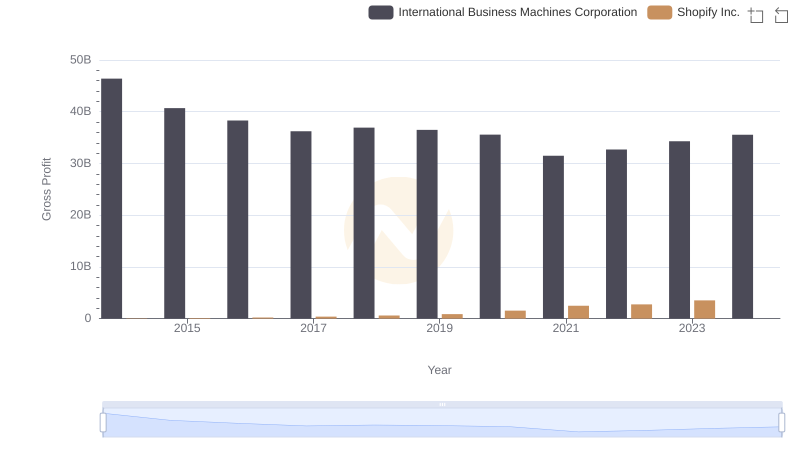
International Business Machines Corporation and Shopify Inc.: A Detailed Gross Profit Analysis
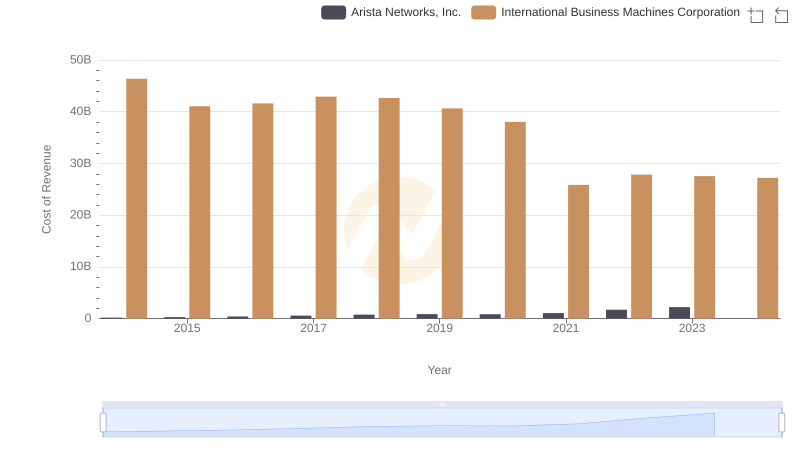
Analyzing Cost of Revenue: International Business Machines Corporation and Arista Networks, Inc.

Analyzing R&D Budgets: International Business Machines Corporation vs Shopify Inc.
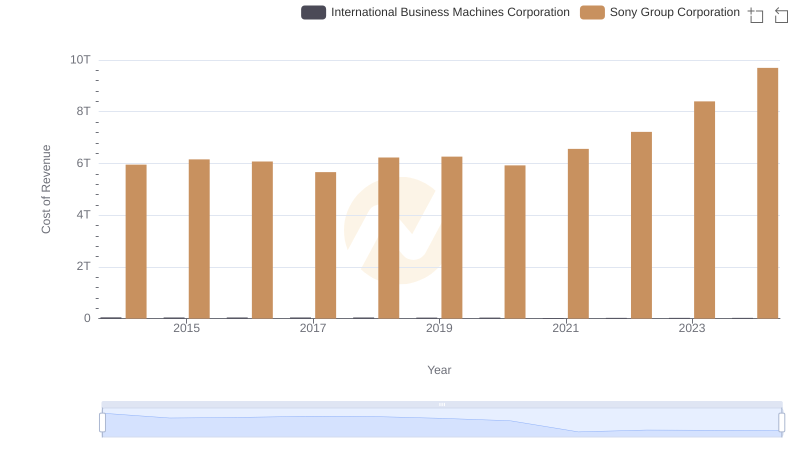
Cost of Revenue: Key Insights for International Business Machines Corporation and Sony Group Corporation
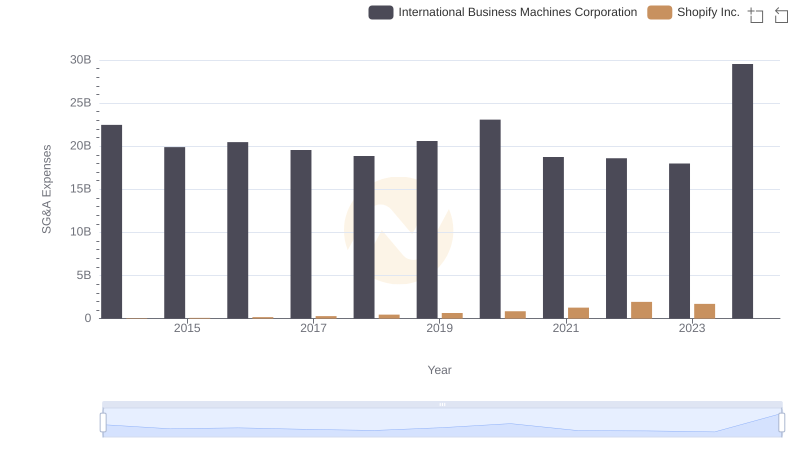
International Business Machines Corporation vs Shopify Inc.: SG&A Expense Trends