| __timestamp | International Business Machines Corporation | Texas Instruments Incorporated |
|---|---|---|
| Wednesday, January 1, 2014 | 46386000000 | 5618000000 |
| Thursday, January 1, 2015 | 41057000000 | 5440000000 |
| Friday, January 1, 2016 | 41403000000 | 5130000000 |
| Sunday, January 1, 2017 | 42196000000 | 5347000000 |
| Monday, January 1, 2018 | 42655000000 | 5507000000 |
| Tuesday, January 1, 2019 | 26181000000 | 5219000000 |
| Wednesday, January 1, 2020 | 24314000000 | 5192000000 |
| Friday, January 1, 2021 | 25865000000 | 5968000000 |
| Saturday, January 1, 2022 | 27842000000 | 6257000000 |
| Sunday, January 1, 2023 | 27560000000 | 6500000000 |
| Monday, January 1, 2024 | 27202000000 | 6547000000 |
Unlocking the unknown
In the ever-evolving landscape of technology, understanding the financial dynamics of industry giants like International Business Machines Corporation (IBM) and Texas Instruments Incorporated (TXN) is crucial. Over the past decade, IBM's cost of revenue has seen a significant decline, dropping from approximately $46 billion in 2014 to around $27 billion in 2024. This represents a reduction of nearly 41%, reflecting IBM's strategic shift towards more efficient operations and possibly a focus on higher-margin services.
Conversely, Texas Instruments has maintained a more stable cost structure, with its cost of revenue increasing modestly from about $5.6 billion in 2014 to $6.5 billion in 2024, a rise of roughly 16%. This stability underscores TXN's consistent growth in the semiconductor market. As these companies navigate the complexities of the tech industry, their financial strategies offer valuable insights into their operational priorities and market positioning.
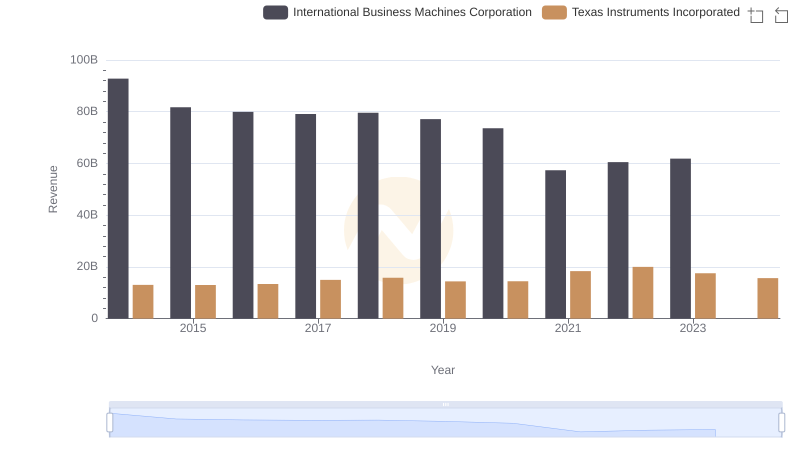
Annual Revenue Comparison: International Business Machines Corporation vs Texas Instruments Incorporated
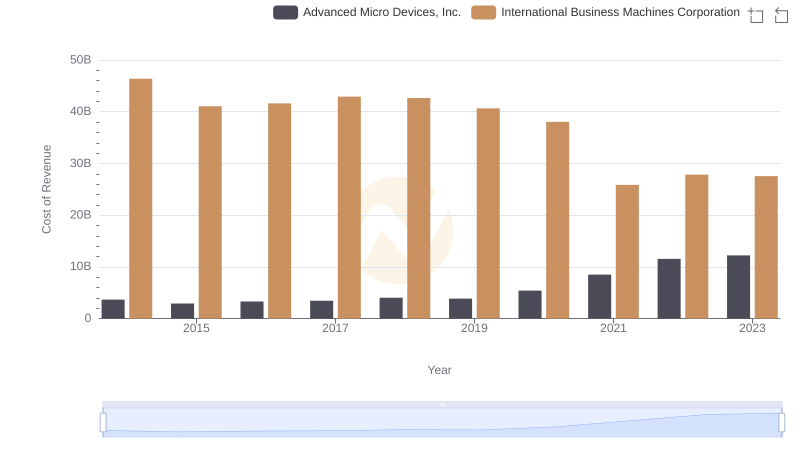
Cost of Revenue Trends: International Business Machines Corporation vs Advanced Micro Devices, Inc.
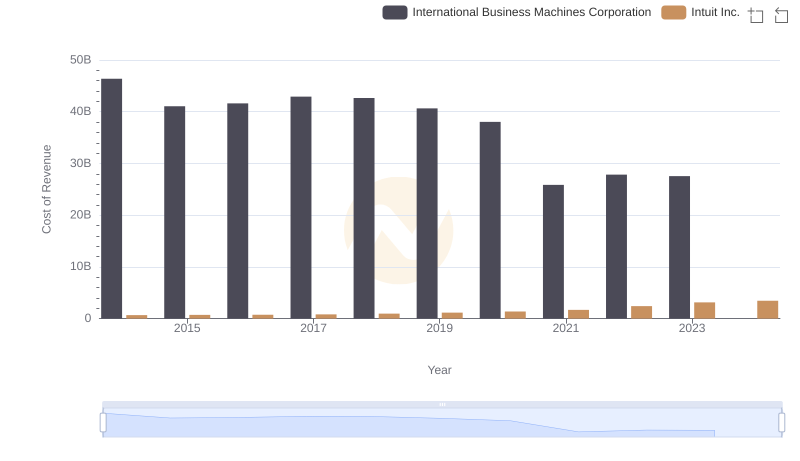
Cost of Revenue Comparison: International Business Machines Corporation vs Intuit Inc.
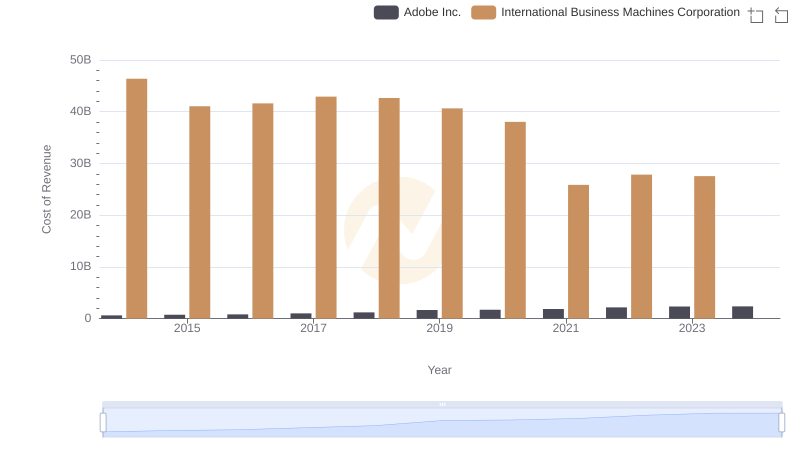
Cost of Revenue Trends: International Business Machines Corporation vs Adobe Inc.
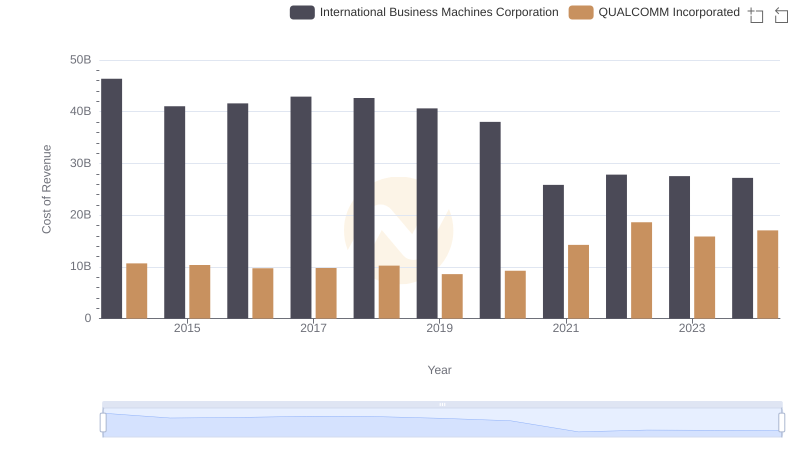
Cost of Revenue Comparison: International Business Machines Corporation vs QUALCOMM Incorporated
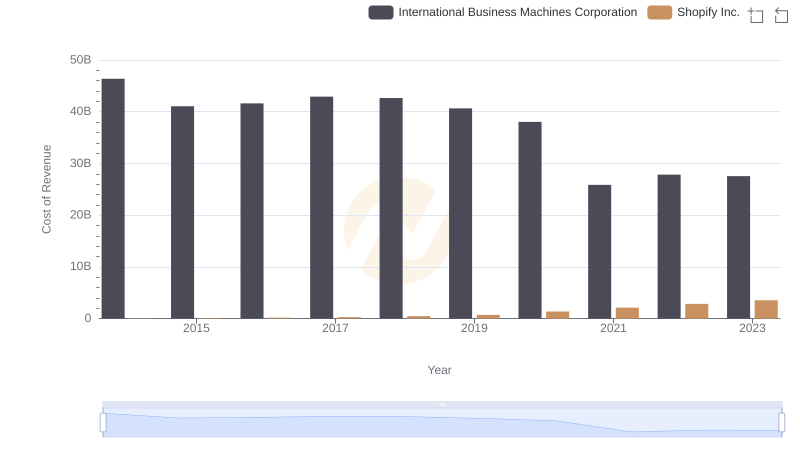
Analyzing Cost of Revenue: International Business Machines Corporation and Shopify Inc.
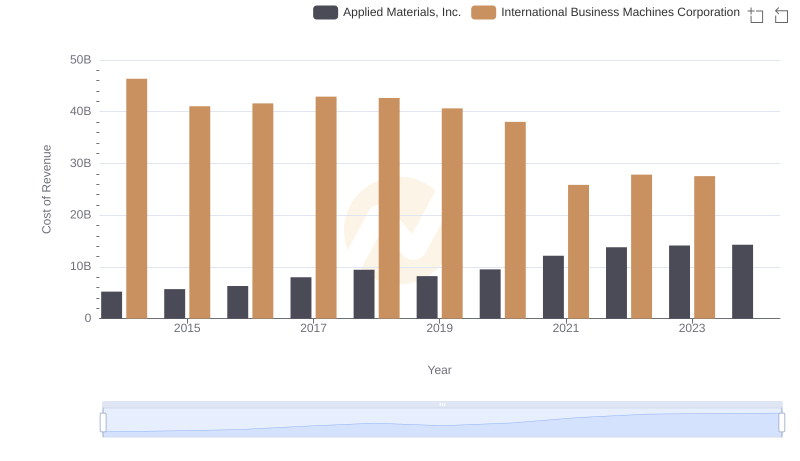
Cost of Revenue: Key Insights for International Business Machines Corporation and Applied Materials, Inc.
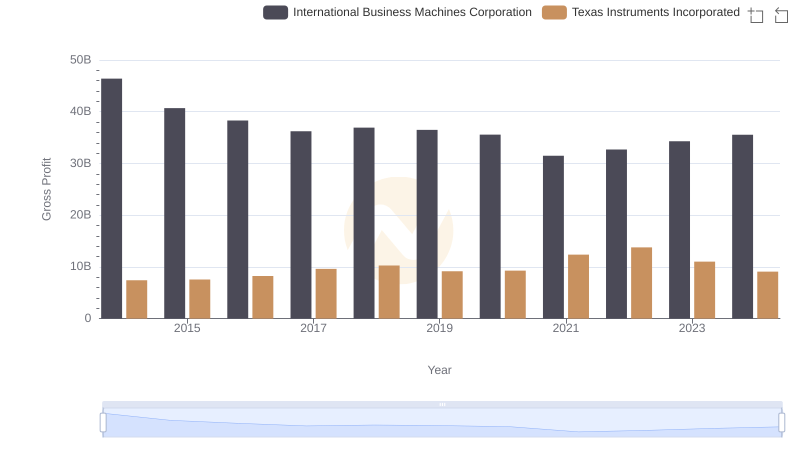
Gross Profit Comparison: International Business Machines Corporation and Texas Instruments Incorporated Trends
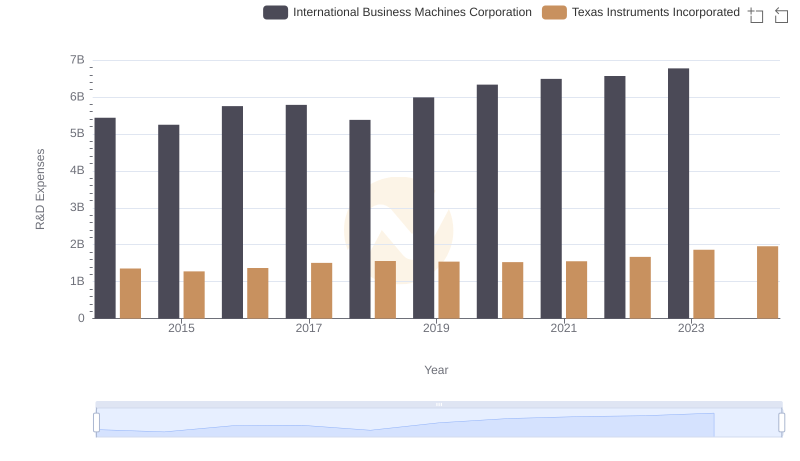
R&D Spending Showdown: International Business Machines Corporation vs Texas Instruments Incorporated
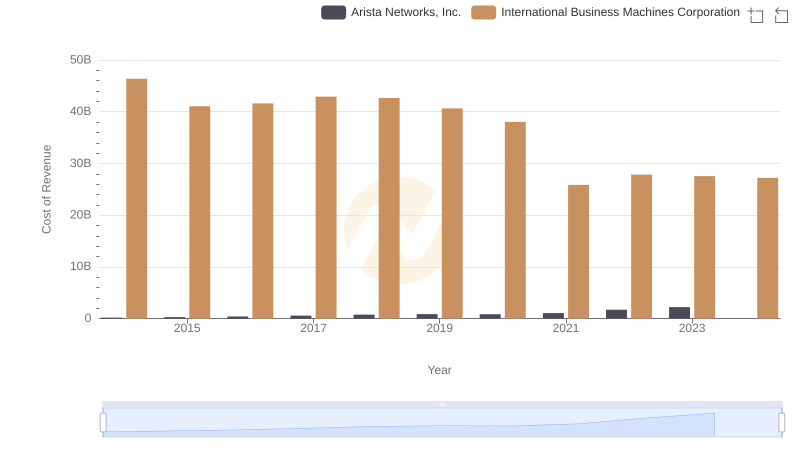
Analyzing Cost of Revenue: International Business Machines Corporation and Arista Networks, Inc.
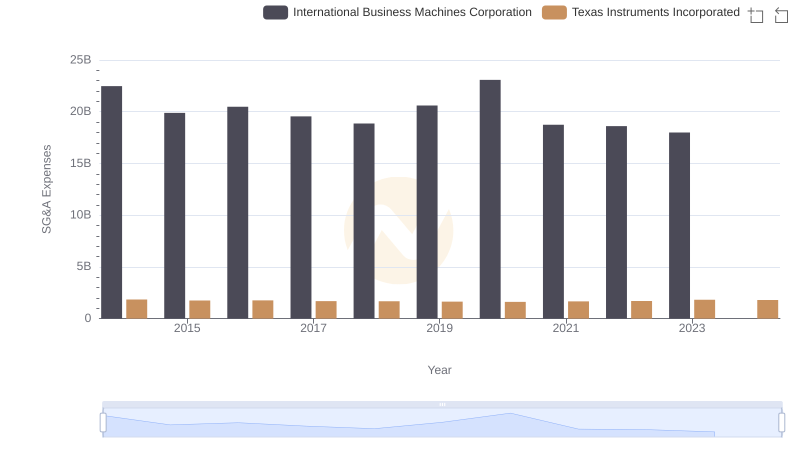
International Business Machines Corporation or Texas Instruments Incorporated: Who Manages SG&A Costs Better?
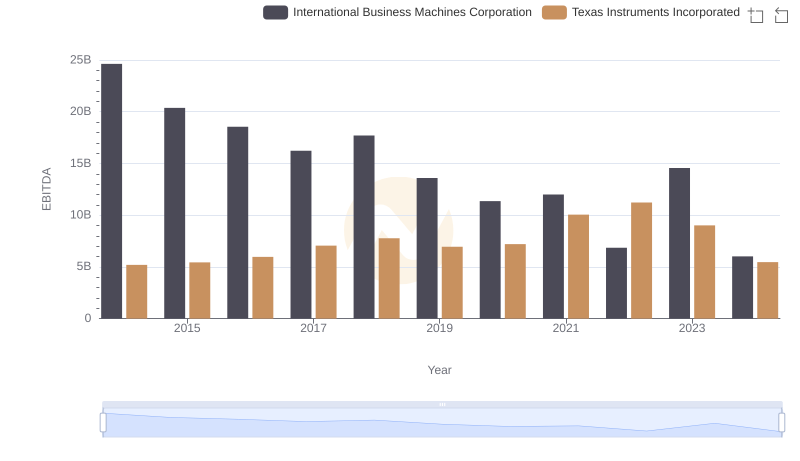
EBITDA Performance Review: International Business Machines Corporation vs Texas Instruments Incorporated