| __timestamp | Applied Materials, Inc. | International Business Machines Corporation |
|---|---|---|
| Wednesday, January 1, 2014 | 1428000000 | 5437000000 |
| Thursday, January 1, 2015 | 1451000000 | 5247000000 |
| Friday, January 1, 2016 | 1540000000 | 5726000000 |
| Sunday, January 1, 2017 | 1774000000 | 5590000000 |
| Monday, January 1, 2018 | 2019000000 | 5379000000 |
| Tuesday, January 1, 2019 | 2054000000 | 5910000000 |
| Wednesday, January 1, 2020 | 2234000000 | 6262000000 |
| Friday, January 1, 2021 | 2485000000 | 6488000000 |
| Saturday, January 1, 2022 | 2771000000 | 6567000000 |
| Sunday, January 1, 2023 | 3102000000 | 6775000000 |
| Monday, January 1, 2024 | 3233000000 | 0 |
Unlocking the unknown
In the ever-evolving tech landscape, research and development (R&D) spending is a key indicator of innovation and future growth. Over the past decade, International Business Machines Corporation (IBM) and Applied Materials, Inc. have been at the forefront of this race. From 2014 to 2023, IBM consistently outspent Applied Materials, with R&D expenses peaking at approximately $6.8 billion in 2023, a 25% increase from 2014. In contrast, Applied Materials saw a remarkable 125% growth in R&D spending, reaching around $3.1 billion in 2023. This surge reflects their aggressive push into new technologies. However, 2024 data for IBM is missing, indicating a potential shift or strategic change. As these tech titans continue to innovate, their R&D investments will likely shape the future of technology, making this showdown a critical watch for industry enthusiasts and investors alike.
"Tech Titans' R&D Race: IBM vs. Applied Materials"
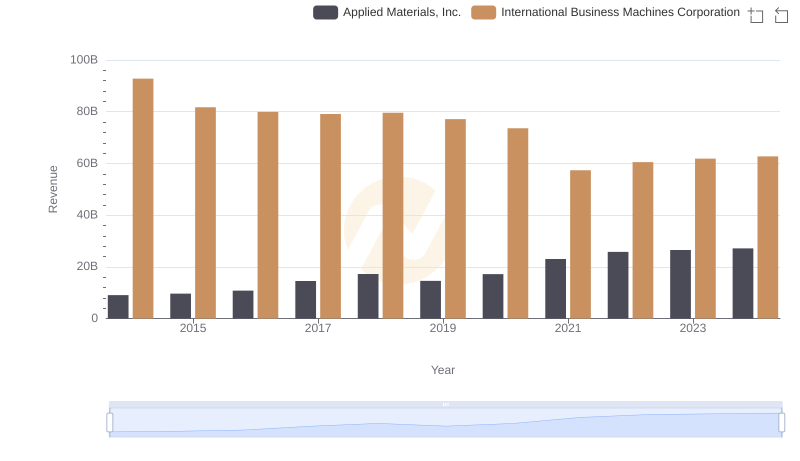
Comparing Revenue Performance: International Business Machines Corporation or Applied Materials, Inc.?
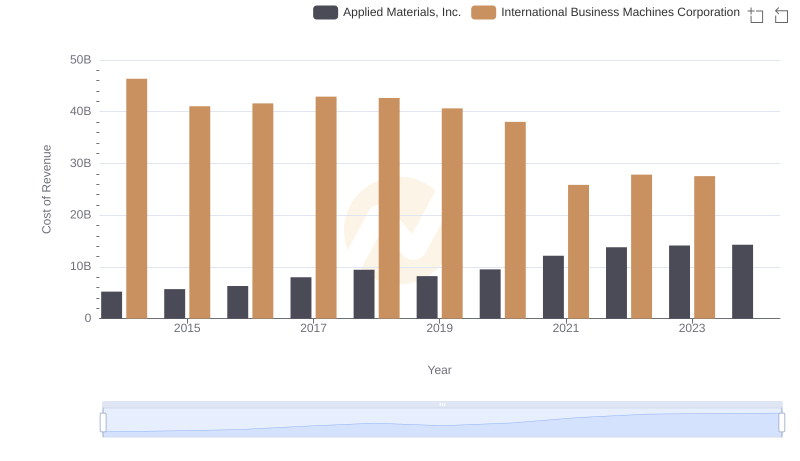
Cost of Revenue: Key Insights for International Business Machines Corporation and Applied Materials, Inc.
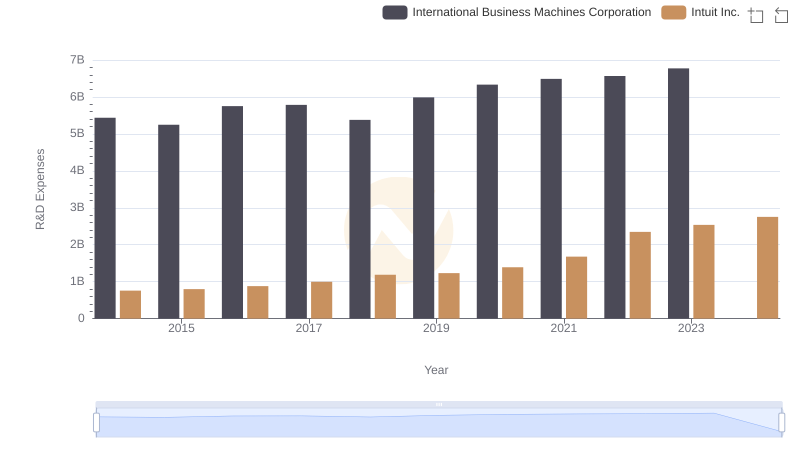
Analyzing R&D Budgets: International Business Machines Corporation vs Intuit Inc.
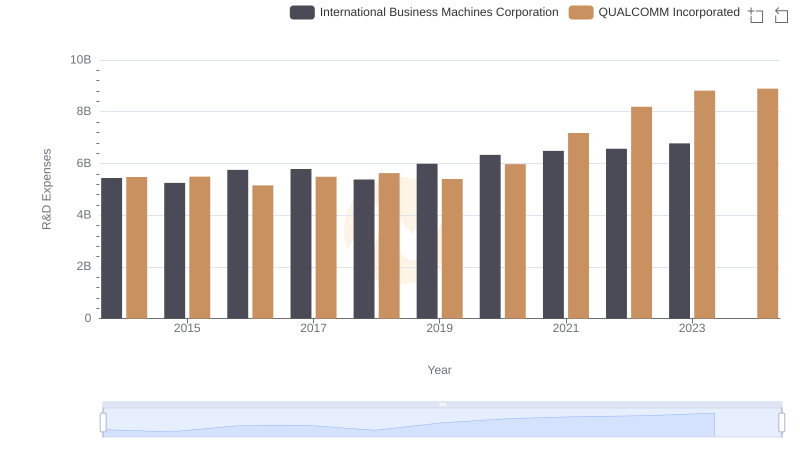
International Business Machines Corporation vs QUALCOMM Incorporated: Strategic Focus on R&D Spending
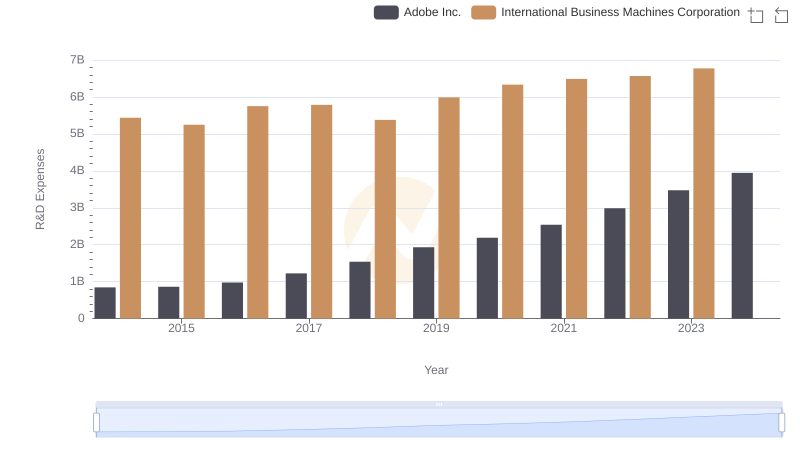
Analyzing R&D Budgets: International Business Machines Corporation vs Adobe Inc.
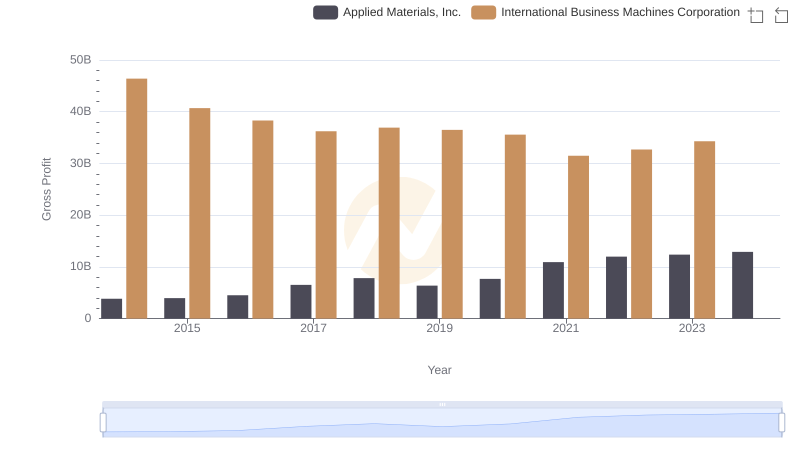
Gross Profit Analysis: Comparing International Business Machines Corporation and Applied Materials, Inc.
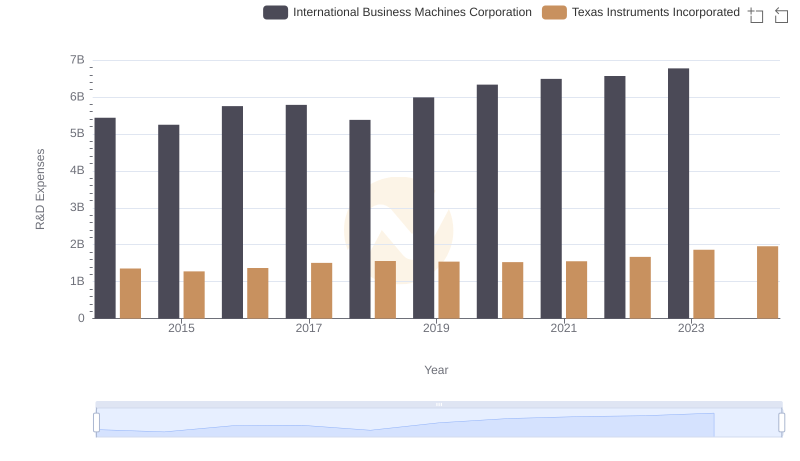
R&D Spending Showdown: International Business Machines Corporation vs Texas Instruments Incorporated

Analyzing R&D Budgets: International Business Machines Corporation vs Shopify Inc.
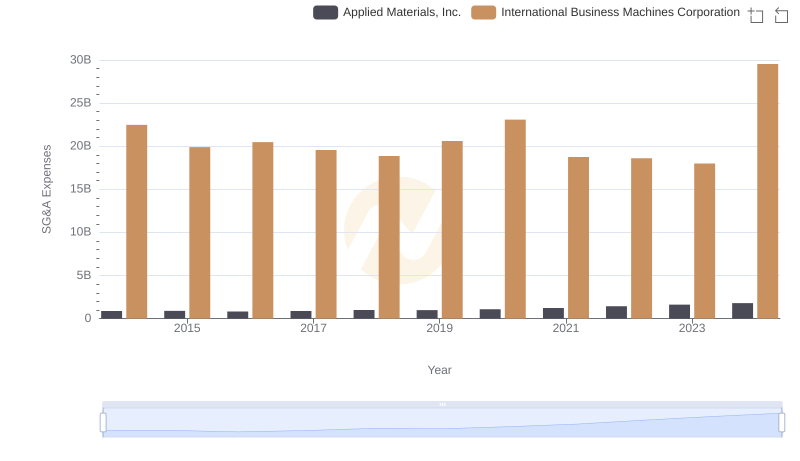
SG&A Efficiency Analysis: Comparing International Business Machines Corporation and Applied Materials, Inc.
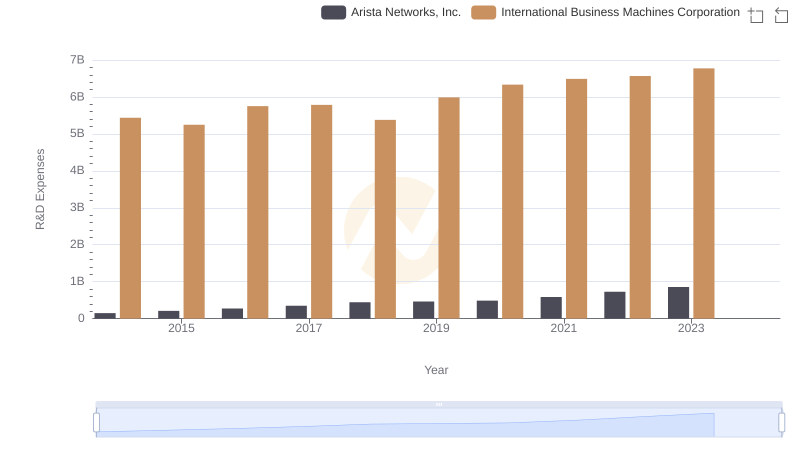
International Business Machines Corporation vs Arista Networks, Inc.: Strategic Focus on R&D Spending
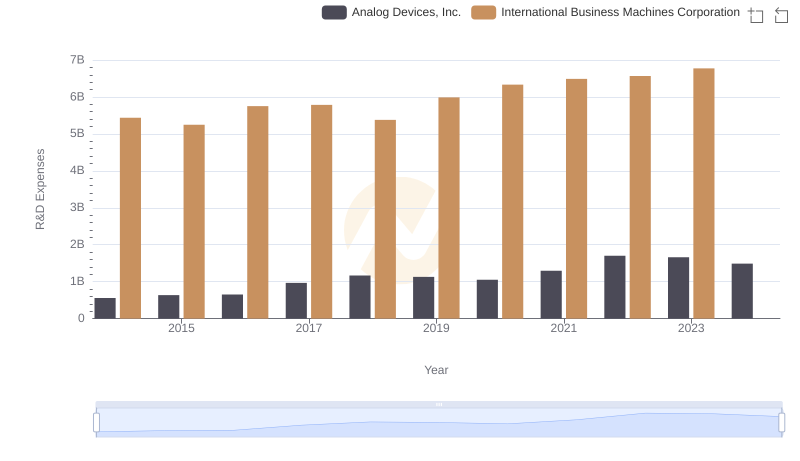
Research and Development Investment: International Business Machines Corporation vs Analog Devices, Inc.
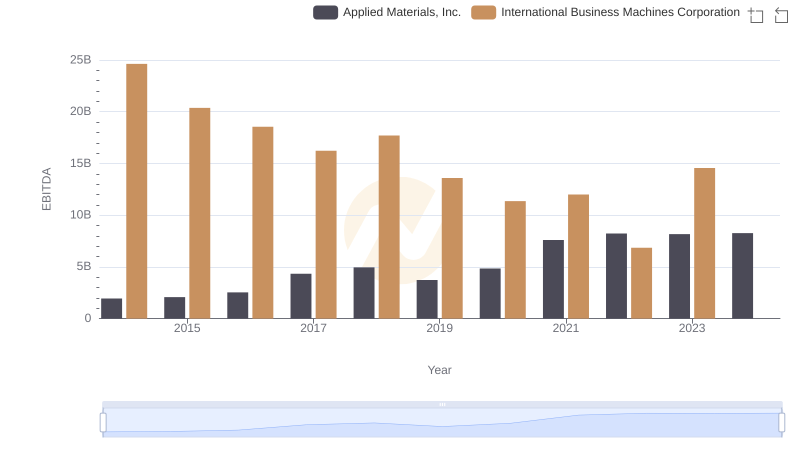
EBITDA Performance Review: International Business Machines Corporation vs Applied Materials, Inc.