| __timestamp | Advanced Micro Devices, Inc. | International Business Machines Corporation |
|---|---|---|
| Wednesday, January 1, 2014 | 3667000000 | 46386000000 |
| Thursday, January 1, 2015 | 2911000000 | 41057000000 |
| Friday, January 1, 2016 | 3316000000 | 41403000000 |
| Sunday, January 1, 2017 | 3466000000 | 42196000000 |
| Monday, January 1, 2018 | 4028000000 | 42655000000 |
| Tuesday, January 1, 2019 | 3863000000 | 26181000000 |
| Wednesday, January 1, 2020 | 5416000000 | 24314000000 |
| Friday, January 1, 2021 | 8505000000 | 25865000000 |
| Saturday, January 1, 2022 | 11550000000 | 27842000000 |
| Sunday, January 1, 2023 | 12220000000 | 27560000000 |
| Monday, January 1, 2024 | 13060000000 | 27202000000 |
Cracking the code
In the ever-evolving landscape of technology, the cost of revenue is a critical metric that reflects a company's operational efficiency. Over the past decade, International Business Machines Corporation (IBM) and Advanced Micro Devices, Inc. (AMD) have showcased contrasting trends in this area.
From 2014 to 2023, IBM's cost of revenue has seen a gradual decline, dropping from approximately $46 billion to $27.6 billion. This 40% reduction highlights IBM's strategic shift towards more efficient operations and possibly a focus on higher-margin services.
Conversely, AMD's cost of revenue has surged by over 230%, from $3.7 billion in 2014 to $12.2 billion in 2023. This increase underscores AMD's aggressive expansion and growing market share in the semiconductor industry.
The data for 2024 is incomplete, but the trends suggest continued strategic evolution for both companies.
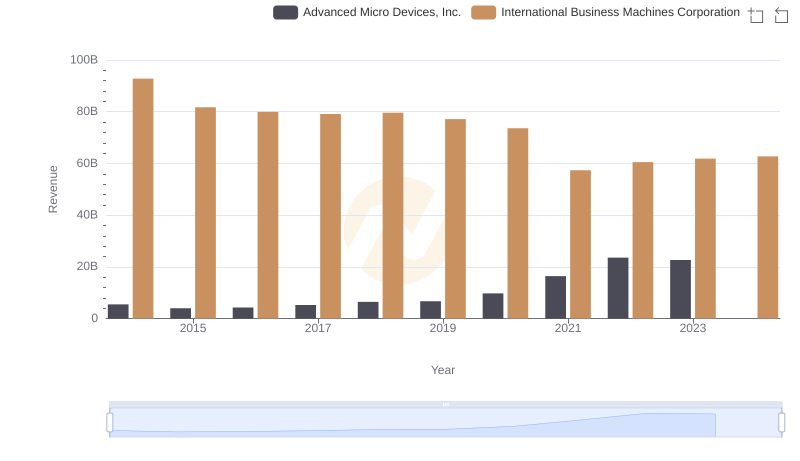
Breaking Down Revenue Trends: International Business Machines Corporation vs Advanced Micro Devices, Inc.
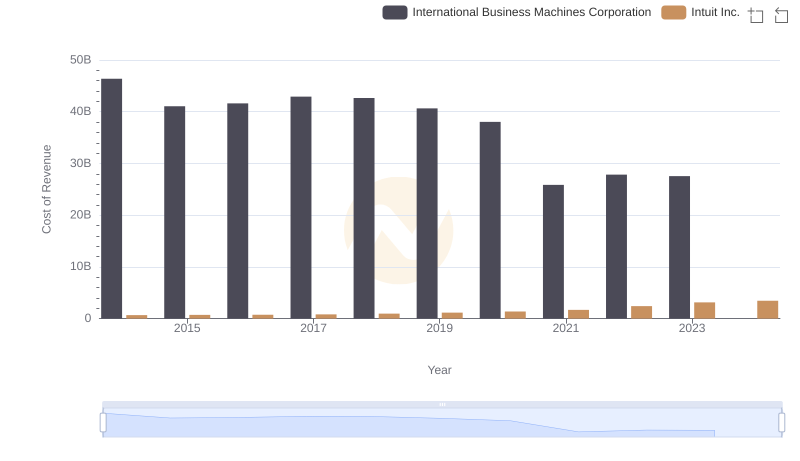
Cost of Revenue Comparison: International Business Machines Corporation vs Intuit Inc.
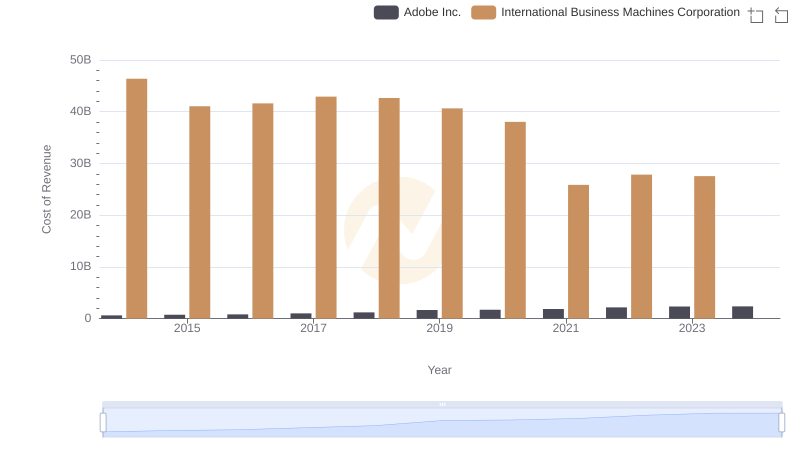
Cost of Revenue Trends: International Business Machines Corporation vs Adobe Inc.
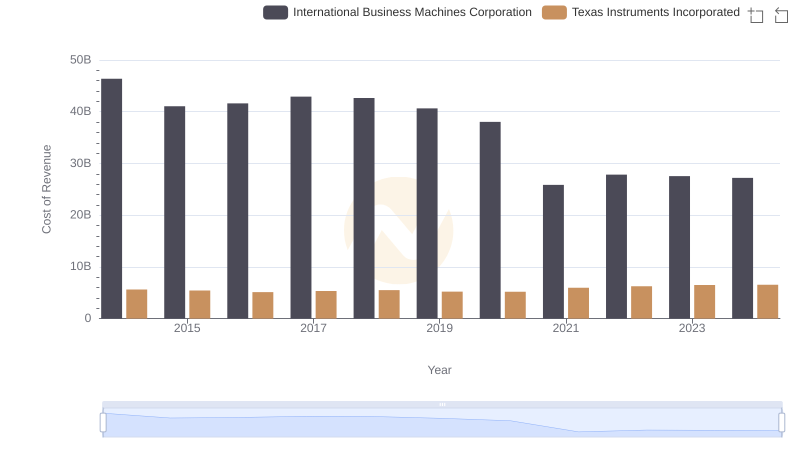
Cost Insights: Breaking Down International Business Machines Corporation and Texas Instruments Incorporated's Expenses
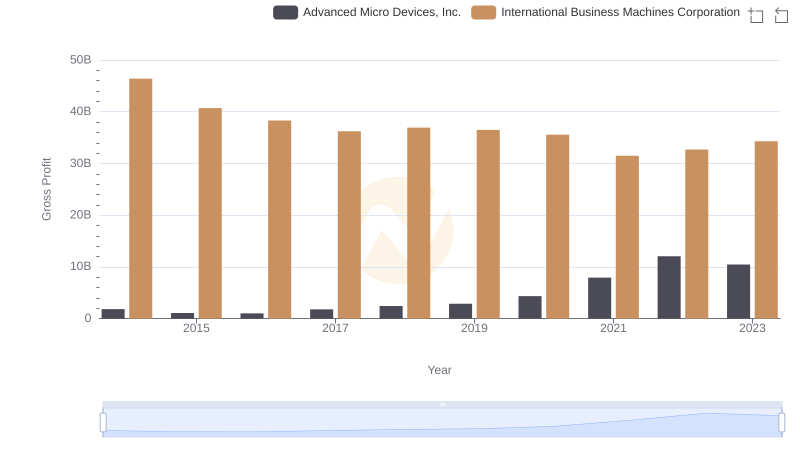
Key Insights on Gross Profit: International Business Machines Corporation vs Advanced Micro Devices, Inc.
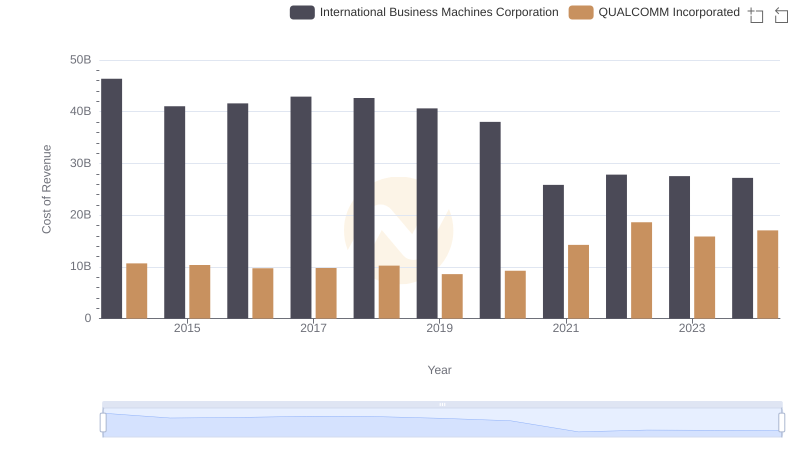
Cost of Revenue Comparison: International Business Machines Corporation vs QUALCOMM Incorporated
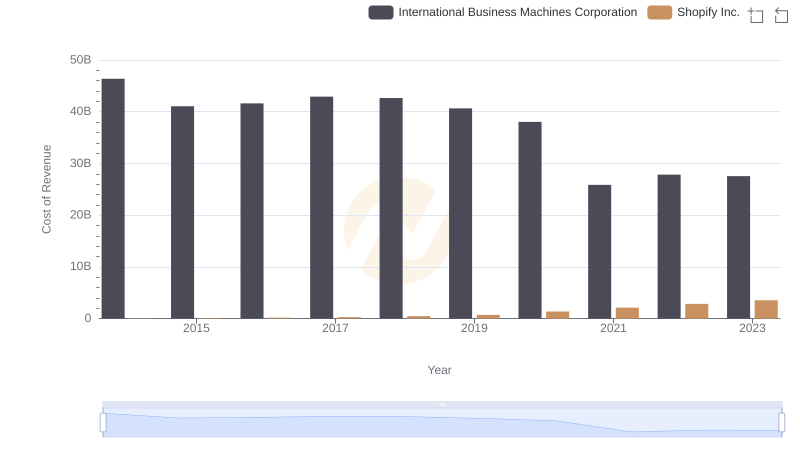
Analyzing Cost of Revenue: International Business Machines Corporation and Shopify Inc.
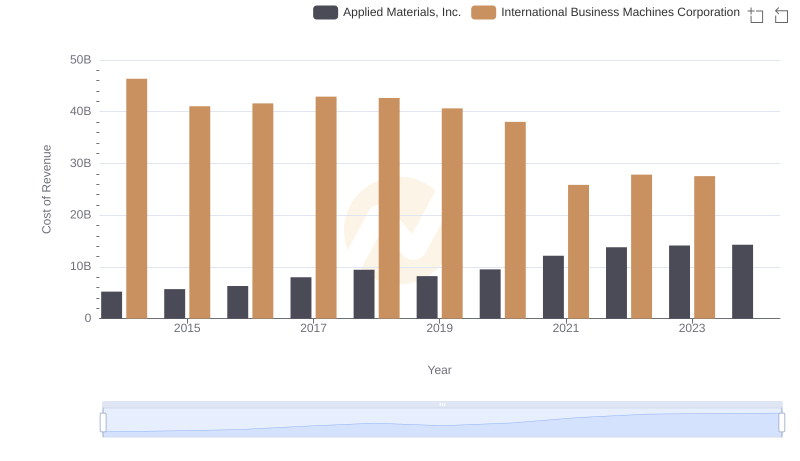
Cost of Revenue: Key Insights for International Business Machines Corporation and Applied Materials, Inc.
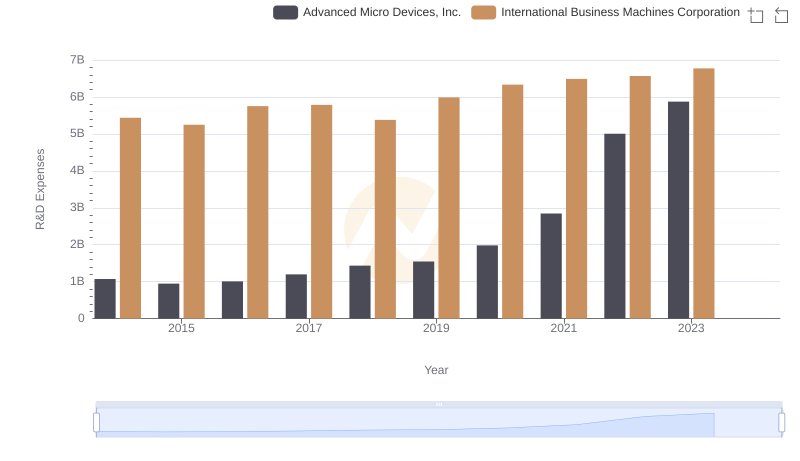
R&D Insights: How International Business Machines Corporation and Advanced Micro Devices, Inc. Allocate Funds
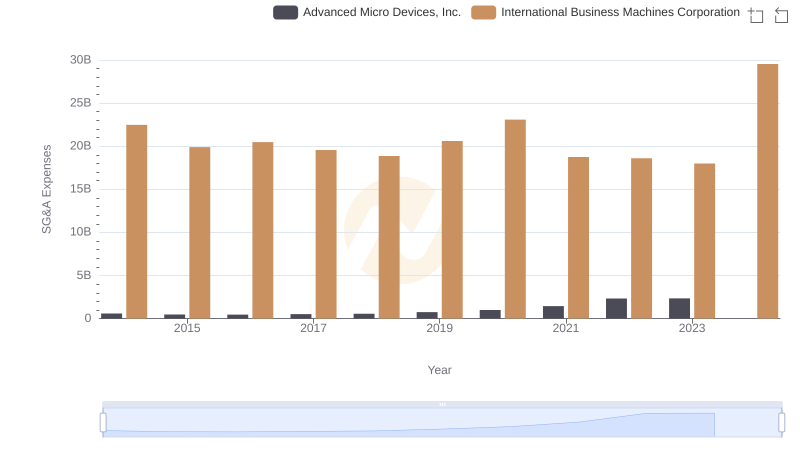
Operational Costs Compared: SG&A Analysis of International Business Machines Corporation and Advanced Micro Devices, Inc.
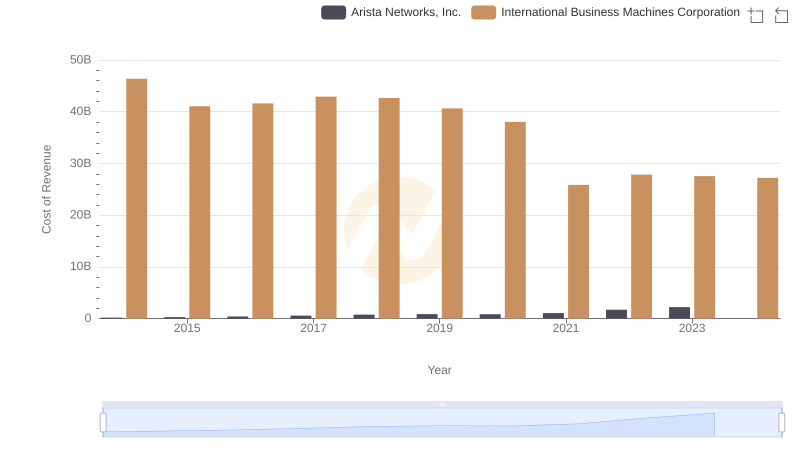
Analyzing Cost of Revenue: International Business Machines Corporation and Arista Networks, Inc.
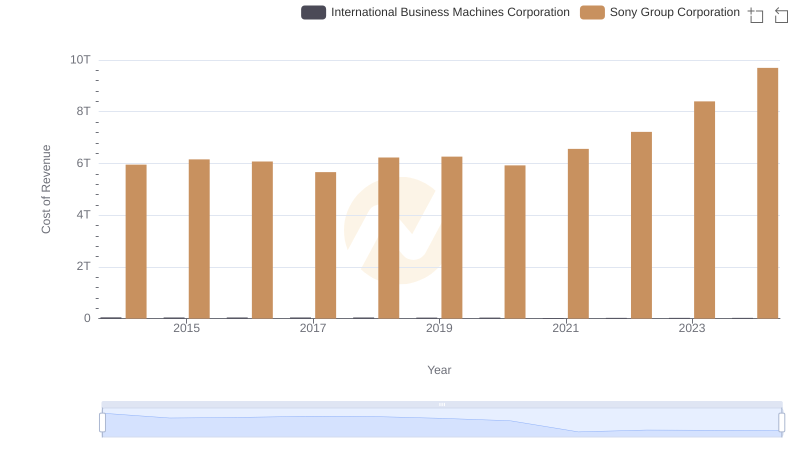
Cost of Revenue: Key Insights for International Business Machines Corporation and Sony Group Corporation