| __timestamp | Applied Materials, Inc. | International Business Machines Corporation |
|---|---|---|
| Wednesday, January 1, 2014 | 9072000000 | 92793000000 |
| Thursday, January 1, 2015 | 9659000000 | 81742000000 |
| Friday, January 1, 2016 | 10825000000 | 79920000000 |
| Sunday, January 1, 2017 | 14537000000 | 79139000000 |
| Monday, January 1, 2018 | 17253000000 | 79591000000 |
| Tuesday, January 1, 2019 | 14608000000 | 57714000000 |
| Wednesday, January 1, 2020 | 17202000000 | 55179000000 |
| Friday, January 1, 2021 | 23063000000 | 57351000000 |
| Saturday, January 1, 2022 | 25785000000 | 60530000000 |
| Sunday, January 1, 2023 | 26517000000 | 61860000000 |
| Monday, January 1, 2024 | 27176000000 | 62753000000 |
Unleashing the power of data
In the ever-evolving landscape of technology, revenue performance is a key indicator of a company's market position and growth potential. This chart offers a fascinating glimpse into the revenue trajectories of two industry titans: International Business Machines Corporation (IBM) and Applied Materials, Inc., from 2014 to 2024.
IBM, a stalwart in the tech industry, has seen its revenue fluctuate over the years, peaking in 2014 and experiencing a gradual decline thereafter. By 2024, IBM's revenue is projected to be approximately 32% lower than its 2014 peak. In contrast, Applied Materials, a leader in materials engineering solutions, has demonstrated a robust growth trajectory, with its revenue more than doubling over the same period.
While IBM's revenue reflects the challenges of adapting to a rapidly changing tech landscape, Applied Materials' consistent growth underscores its strategic positioning in the semiconductor industry. This comparison highlights the dynamic nature of the tech sector and the varying strategies companies employ to maintain their competitive edge.
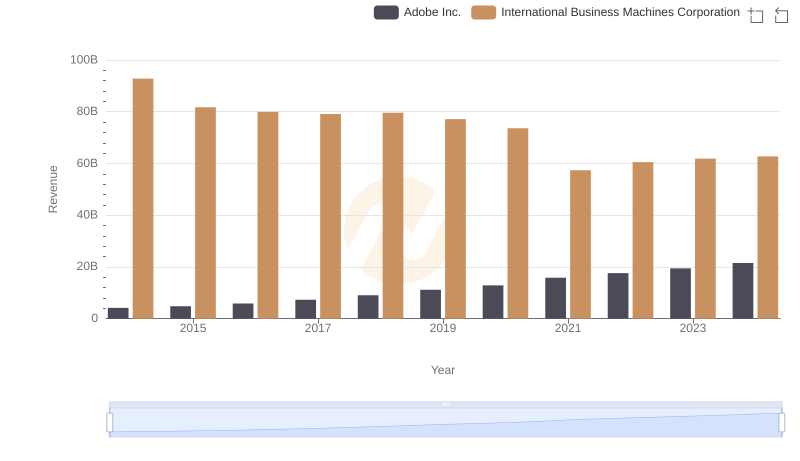
Who Generates More Revenue? International Business Machines Corporation or Adobe Inc.
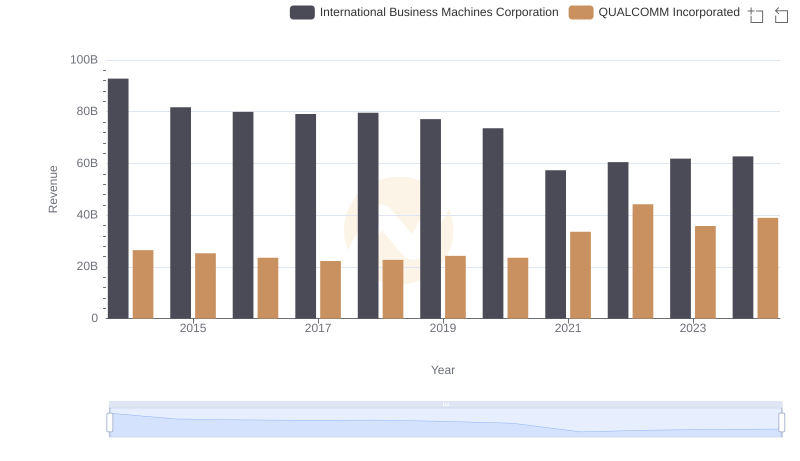
Comparing Revenue Performance: International Business Machines Corporation or QUALCOMM Incorporated?
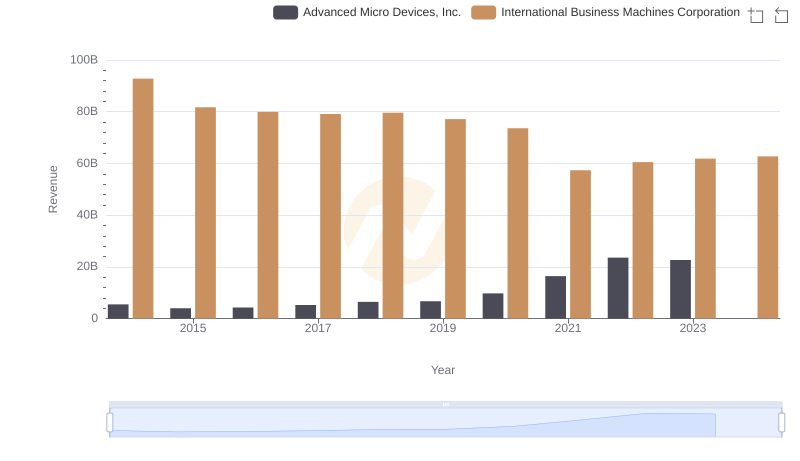
Breaking Down Revenue Trends: International Business Machines Corporation vs Advanced Micro Devices, Inc.
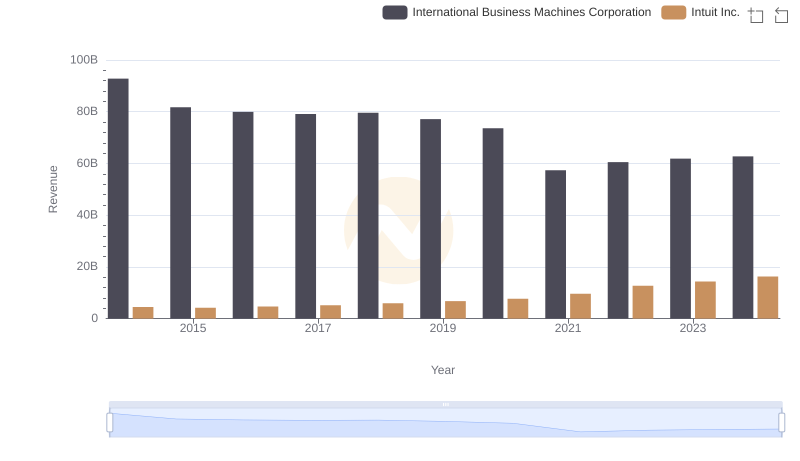
Annual Revenue Comparison: International Business Machines Corporation vs Intuit Inc.
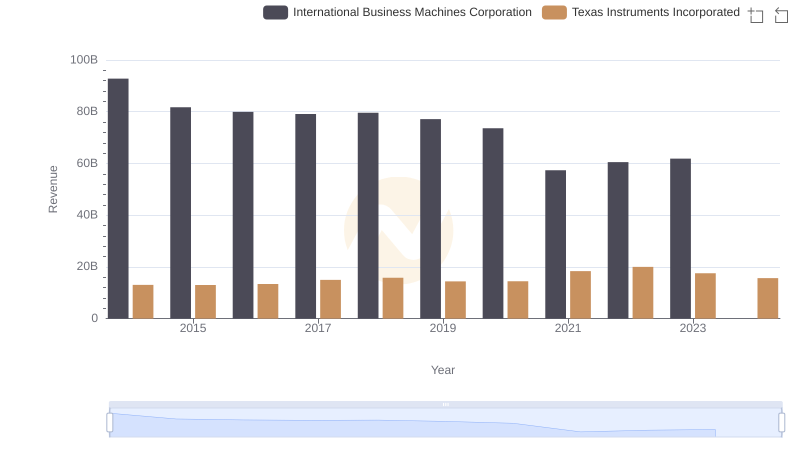
Annual Revenue Comparison: International Business Machines Corporation vs Texas Instruments Incorporated
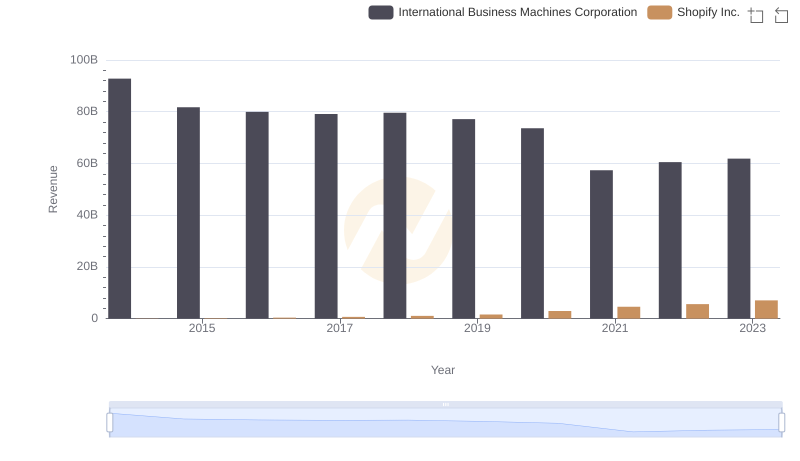
Comparing Revenue Performance: International Business Machines Corporation or Shopify Inc.?
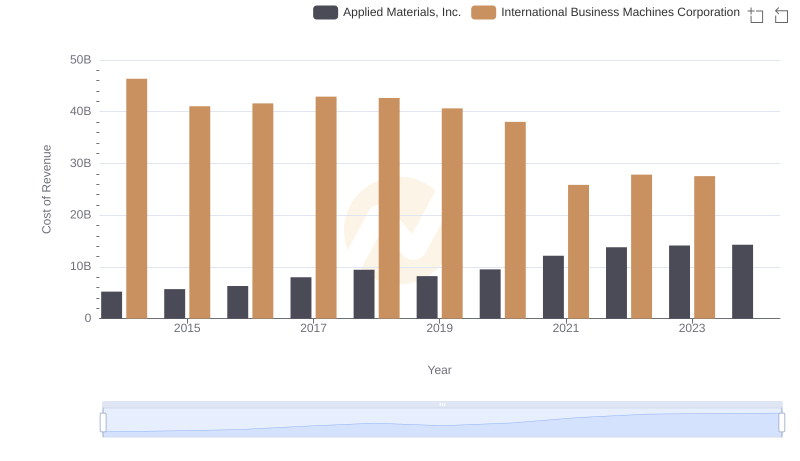
Cost of Revenue: Key Insights for International Business Machines Corporation and Applied Materials, Inc.
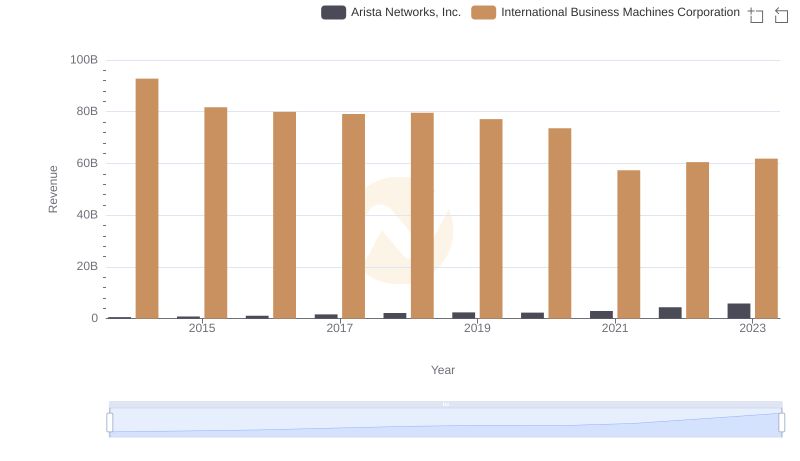
Annual Revenue Comparison: International Business Machines Corporation vs Arista Networks, Inc.
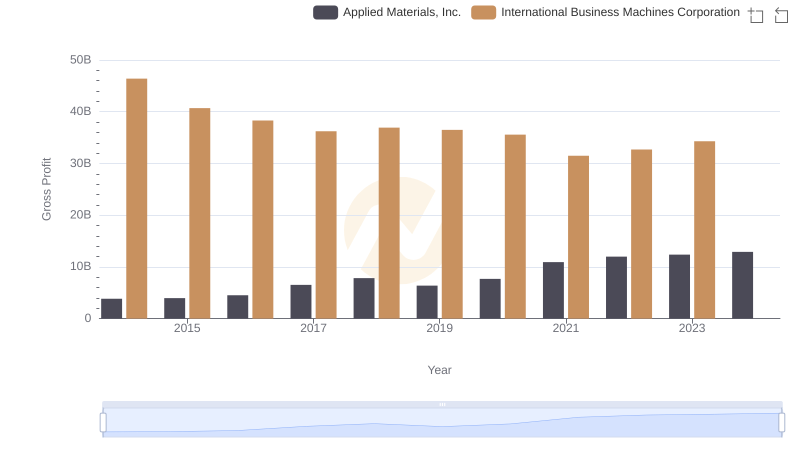
Gross Profit Analysis: Comparing International Business Machines Corporation and Applied Materials, Inc.
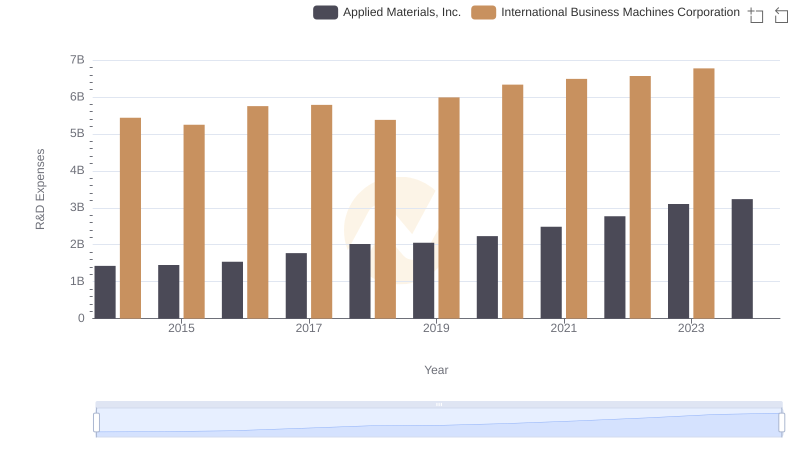
R&D Spending Showdown: International Business Machines Corporation vs Applied Materials, Inc.
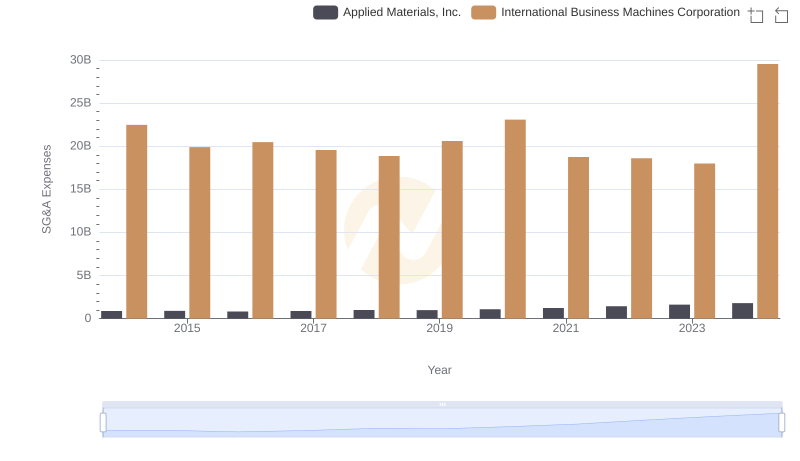
SG&A Efficiency Analysis: Comparing International Business Machines Corporation and Applied Materials, Inc.
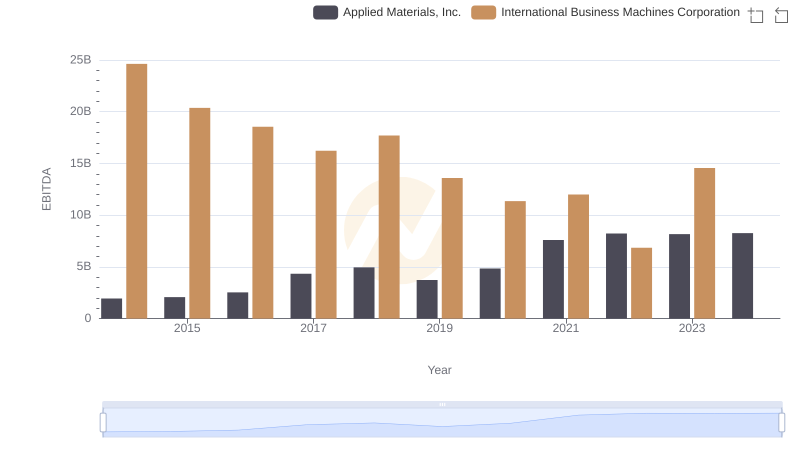
EBITDA Performance Review: International Business Machines Corporation vs Applied Materials, Inc.