| __timestamp | ANSYS, Inc. | International Business Machines Corporation |
|---|---|---|
| Wednesday, January 1, 2014 | 153386000 | 46386000000 |
| Thursday, January 1, 2015 | 147246000 | 41057000000 |
| Friday, January 1, 2016 | 146860000 | 41403000000 |
| Sunday, January 1, 2017 | 150164000 | 42196000000 |
| Monday, January 1, 2018 | 155885000 | 42655000000 |
| Tuesday, January 1, 2019 | 166273000 | 26181000000 |
| Wednesday, January 1, 2020 | 225264000 | 24314000000 |
| Friday, January 1, 2021 | 257984000 | 25865000000 |
| Saturday, January 1, 2022 | 250641000 | 27842000000 |
| Sunday, January 1, 2023 | 271298000 | 27560000000 |
| Monday, January 1, 2024 | 279819000 | 27202000000 |
Unleashing insights
In the ever-evolving landscape of technology, understanding the cost of revenue is crucial for evaluating a company's financial health. This analysis delves into the cost of revenue trends for International Business Machines Corporation (IBM) and ANSYS, Inc. from 2014 to 2023. Over this period, IBM's cost of revenue has seen a significant decline, dropping from approximately $46 billion in 2014 to around $27 billion in 2023, marking a reduction of nearly 41%. This trend reflects IBM's strategic shift towards more efficient operations and cost management. In contrast, ANSYS, Inc. has experienced a steady increase in its cost of revenue, rising from about $153 million in 2014 to $271 million in 2023, an increase of 77%. This growth aligns with ANSYS's expansion and investment in innovative solutions. Notably, data for 2024 is incomplete, highlighting the dynamic nature of financial forecasting.

International Business Machines Corporation and ANSYS, Inc.: A Comprehensive Revenue Analysis
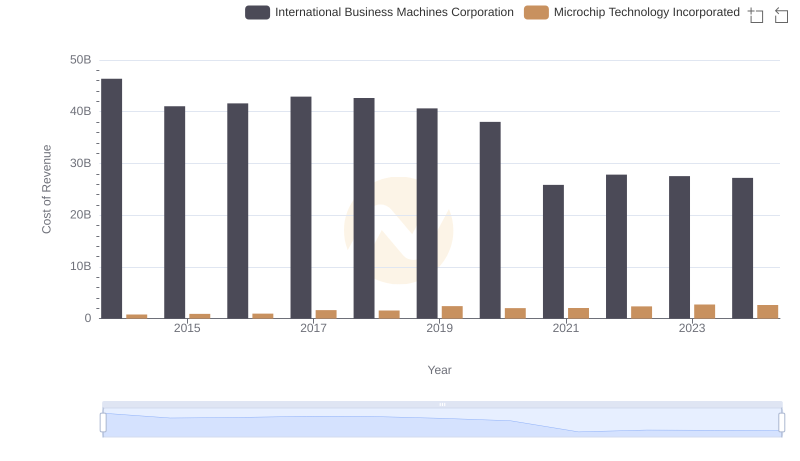
Comparing Cost of Revenue Efficiency: International Business Machines Corporation vs Microchip Technology Incorporated
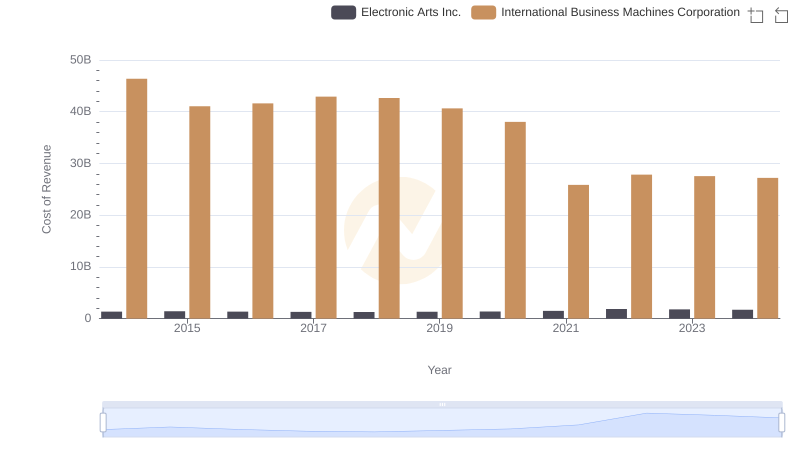
Comparing Cost of Revenue Efficiency: International Business Machines Corporation vs Electronic Arts Inc.
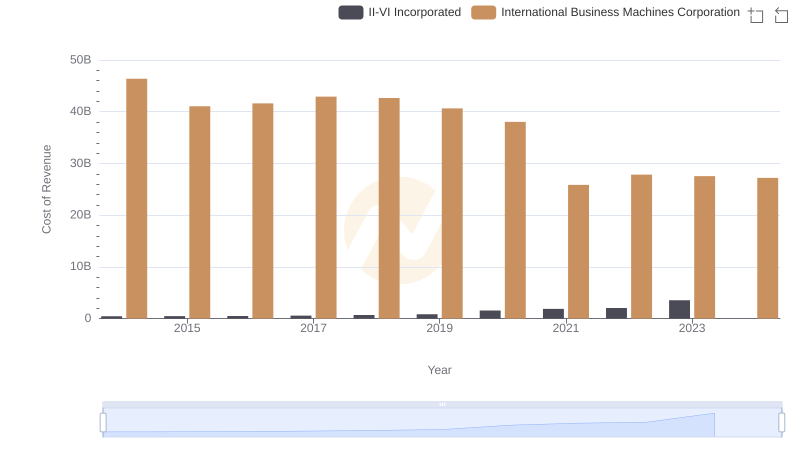
Analyzing Cost of Revenue: International Business Machines Corporation and II-VI Incorporated
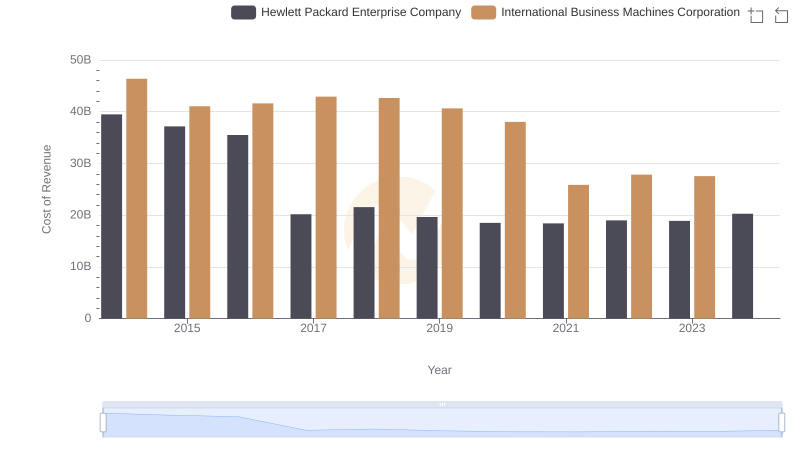
Analyzing Cost of Revenue: International Business Machines Corporation and Hewlett Packard Enterprise Company
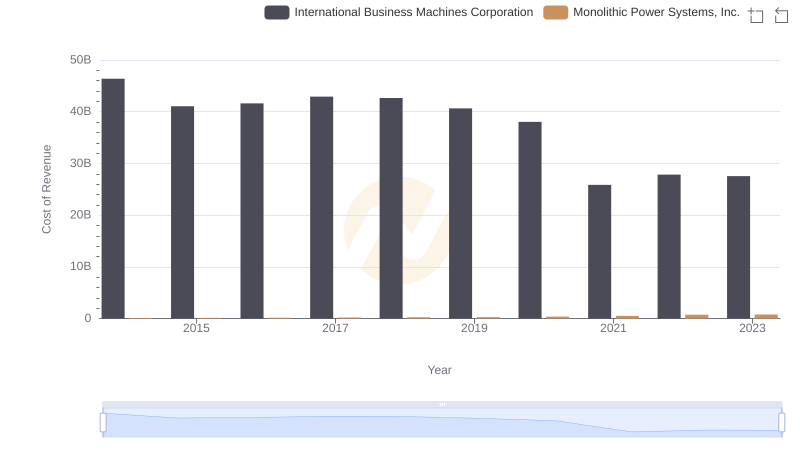
Cost of Revenue Comparison: International Business Machines Corporation vs Monolithic Power Systems, Inc.
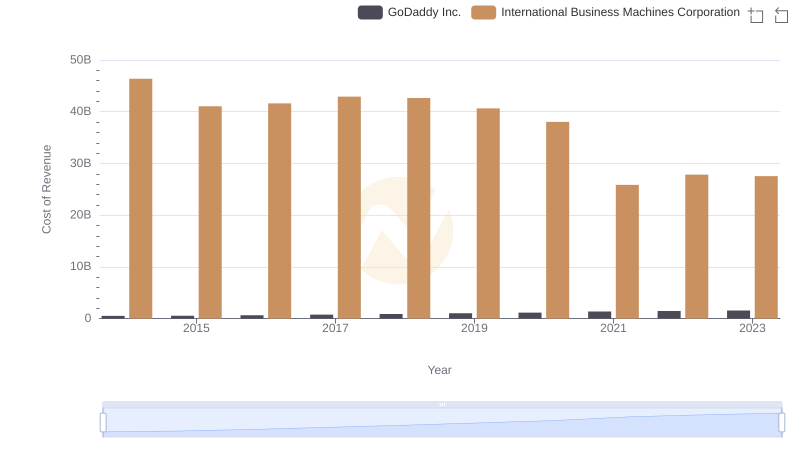
Cost Insights: Breaking Down International Business Machines Corporation and GoDaddy Inc.'s Expenses
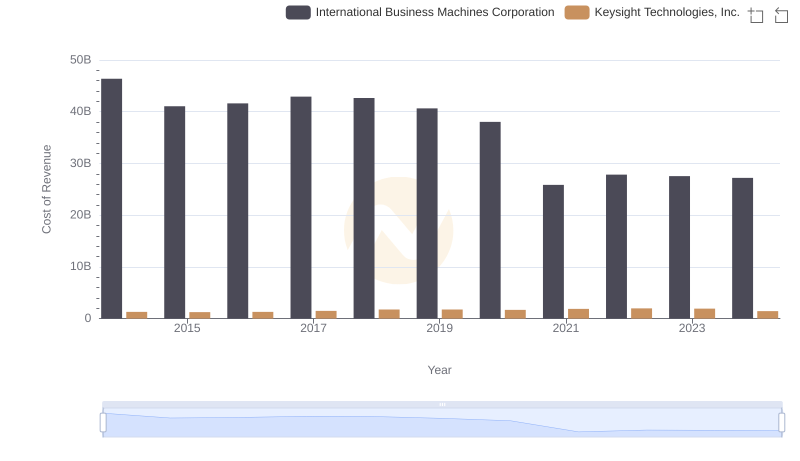
Cost of Revenue Trends: International Business Machines Corporation vs Keysight Technologies, Inc.
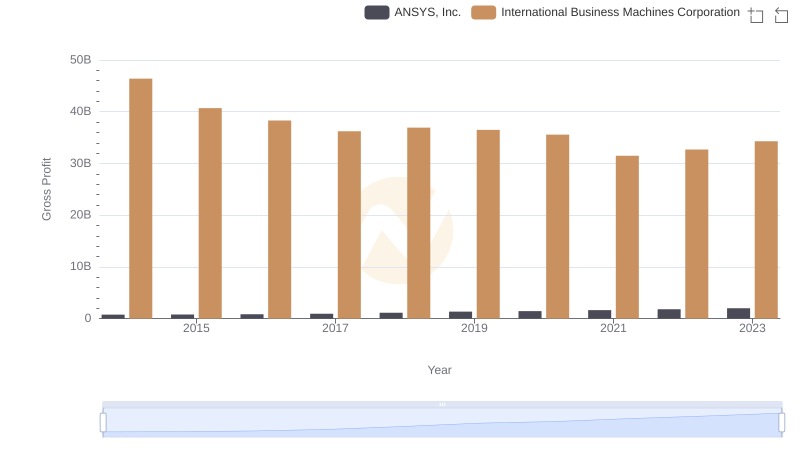
Gross Profit Comparison: International Business Machines Corporation and ANSYS, Inc. Trends
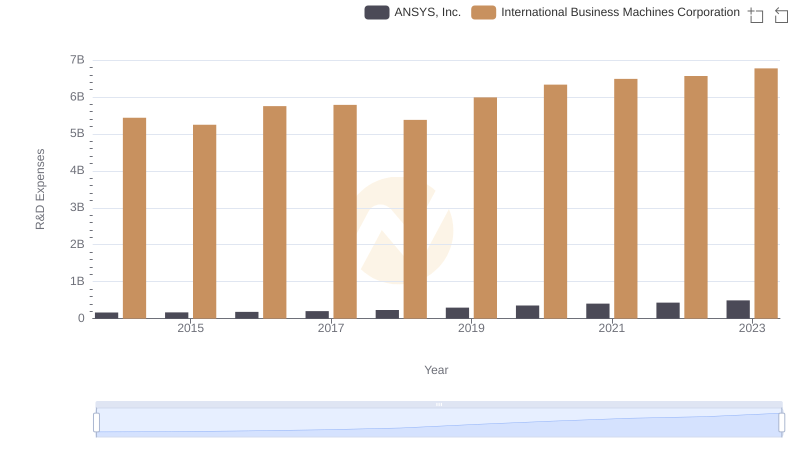
International Business Machines Corporation or ANSYS, Inc.: Who Invests More in Innovation?
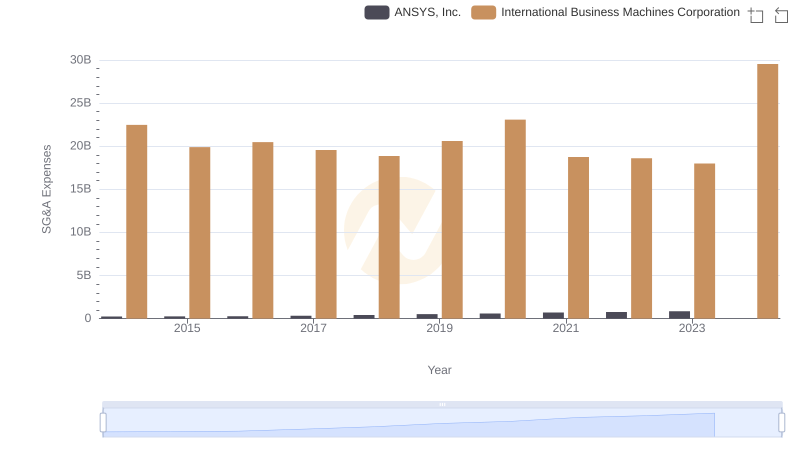
Comparing SG&A Expenses: International Business Machines Corporation vs ANSYS, Inc. Trends and Insights
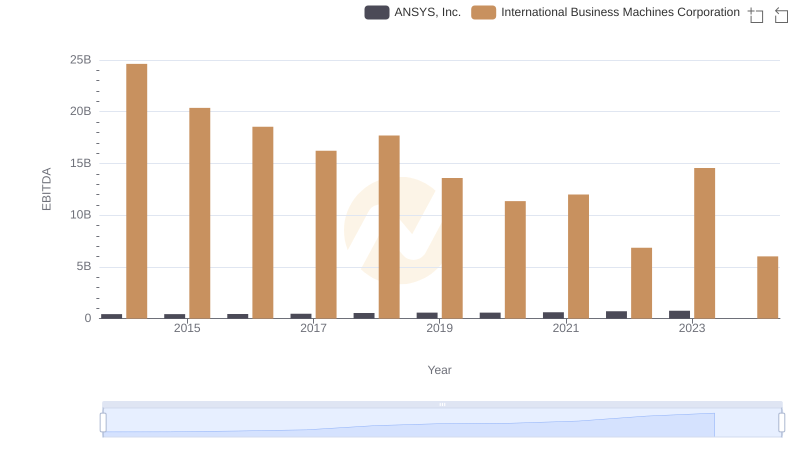
Comparative EBITDA Analysis: International Business Machines Corporation vs ANSYS, Inc.