| __timestamp | International Business Machines Corporation | Monolithic Power Systems, Inc. |
|---|---|---|
| Wednesday, January 1, 2014 | 46386000000 | 129917000 |
| Thursday, January 1, 2015 | 41057000000 | 152898000 |
| Friday, January 1, 2016 | 41403000000 | 177792000 |
| Sunday, January 1, 2017 | 42196000000 | 212646000 |
| Monday, January 1, 2018 | 42655000000 | 259714000 |
| Tuesday, January 1, 2019 | 26181000000 | 281596000 |
| Wednesday, January 1, 2020 | 24314000000 | 378498000 |
| Friday, January 1, 2021 | 25865000000 | 522339000 |
| Saturday, January 1, 2022 | 27842000000 | 745596000 |
| Sunday, January 1, 2023 | 27560000000 | 799953000 |
| Monday, January 1, 2024 | 27202000000 |
Data in motion
In the ever-evolving landscape of technology, the cost of revenue is a critical metric that reflects a company's operational efficiency. From 2014 to 2023, International Business Machines Corporation (IBM) and Monolithic Power Systems, Inc. (MPWR) have showcased contrasting trajectories in this regard. IBM, a stalwart in the tech industry, saw its cost of revenue decrease by approximately 41% over the decade, from a peak in 2014 to a more streamlined figure in 2023. This reduction highlights IBM's strategic shift towards more efficient operations. In contrast, Monolithic Power Systems, a rising star in the semiconductor sector, experienced a sixfold increase in its cost of revenue, reflecting its rapid growth and expansion. The data for 2024 remains incomplete, offering a tantalizing glimpse into the future of these two industry titans. As the tech world continues to evolve, these trends provide valuable insights into the strategic directions of these companies.
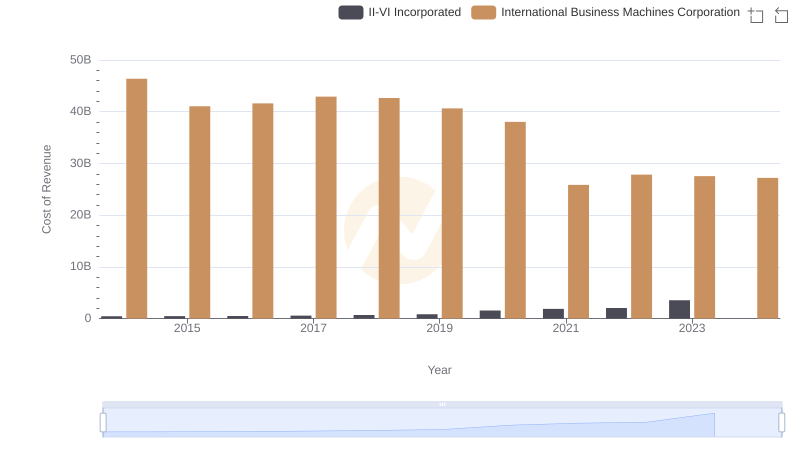
Analyzing Cost of Revenue: International Business Machines Corporation and II-VI Incorporated
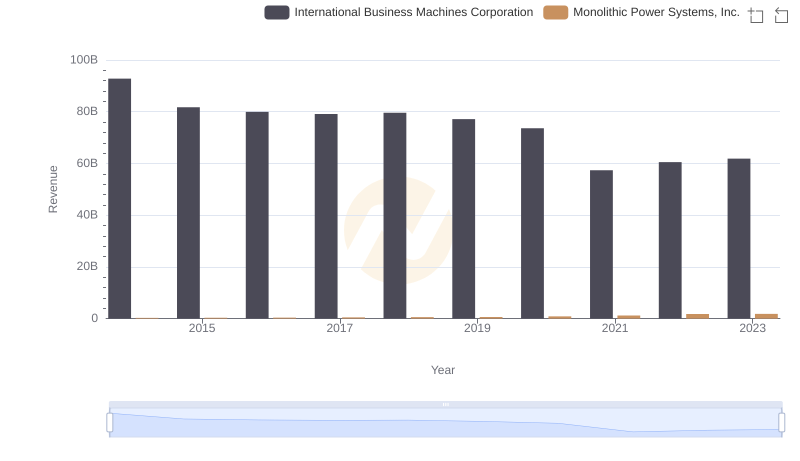
International Business Machines Corporation vs Monolithic Power Systems, Inc.: Examining Key Revenue Metrics
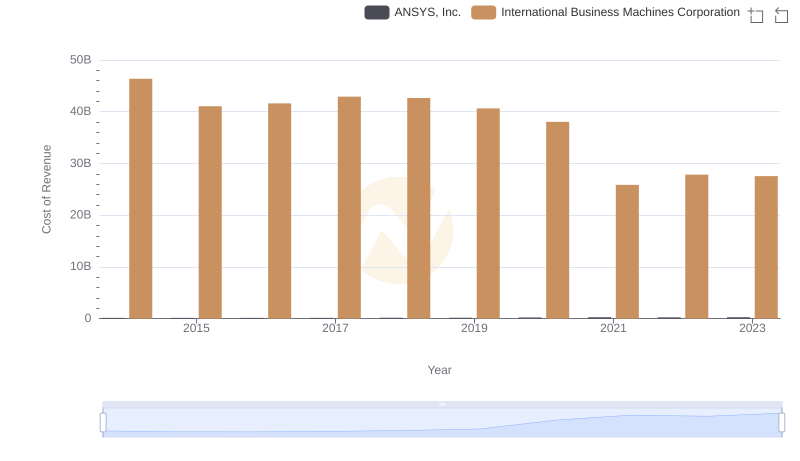
Cost of Revenue: Key Insights for International Business Machines Corporation and ANSYS, Inc.
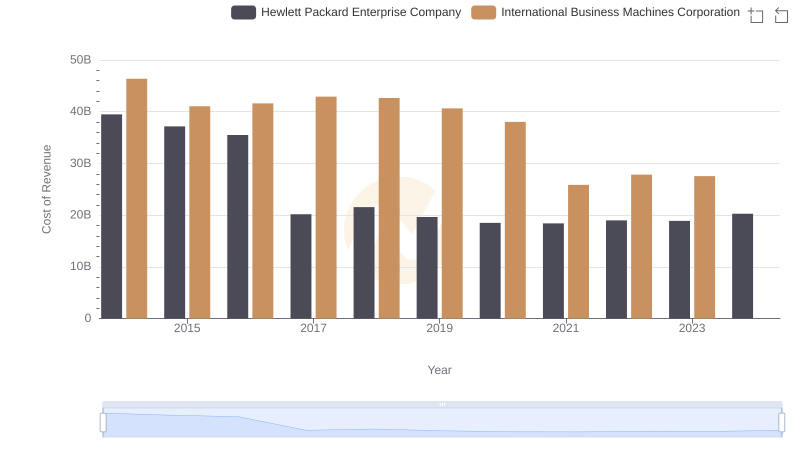
Analyzing Cost of Revenue: International Business Machines Corporation and Hewlett Packard Enterprise Company
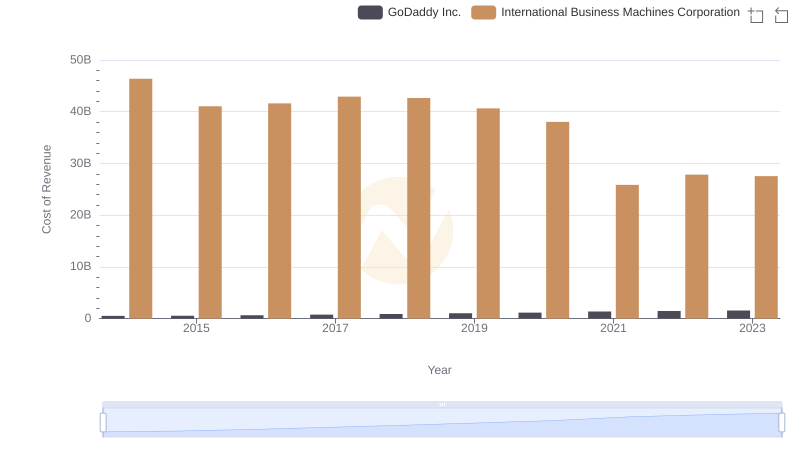
Cost Insights: Breaking Down International Business Machines Corporation and GoDaddy Inc.'s Expenses
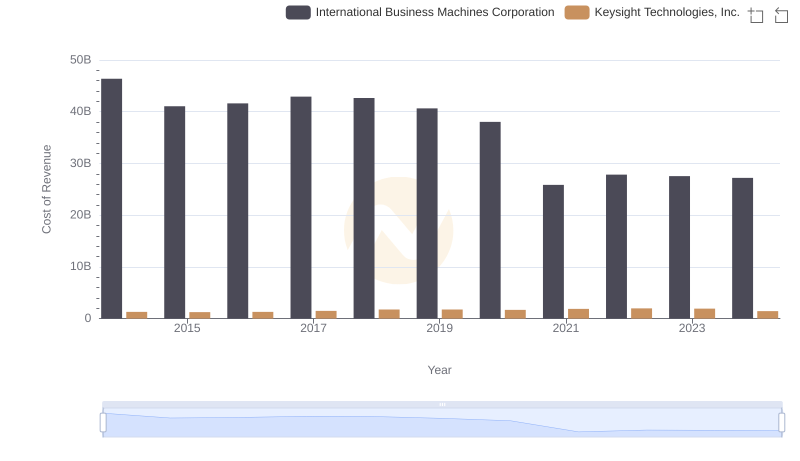
Cost of Revenue Trends: International Business Machines Corporation vs Keysight Technologies, Inc.
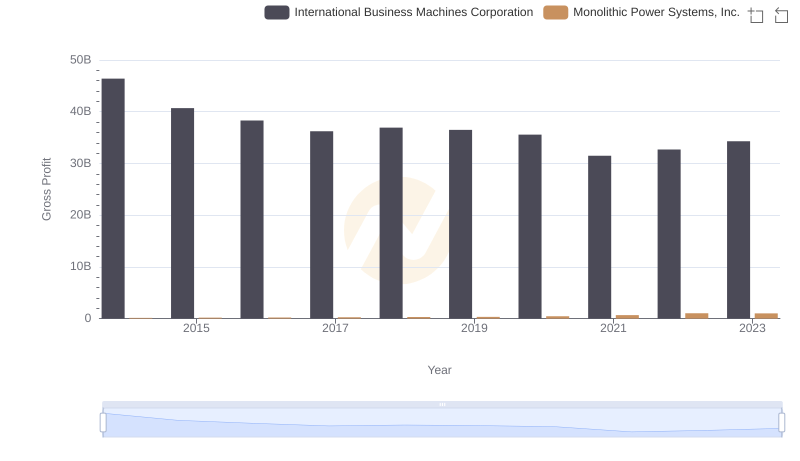
Key Insights on Gross Profit: International Business Machines Corporation vs Monolithic Power Systems, Inc.
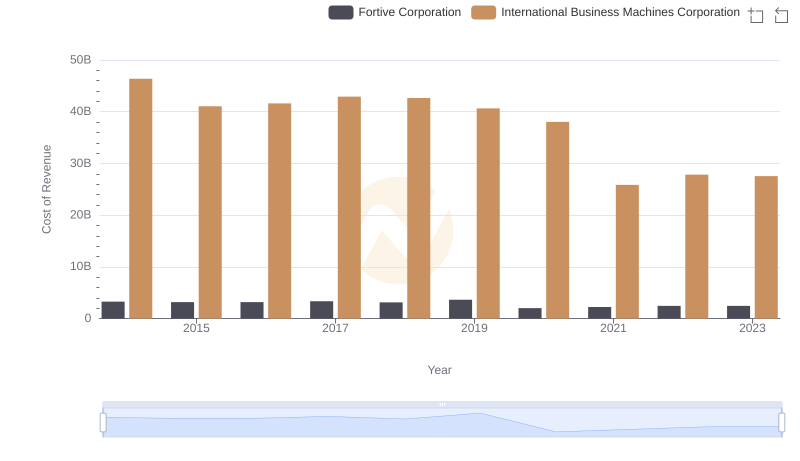
Cost of Revenue Comparison: International Business Machines Corporation vs Fortive Corporation

Analyzing Cost of Revenue: International Business Machines Corporation and Broadridge Financial Solutions, Inc.
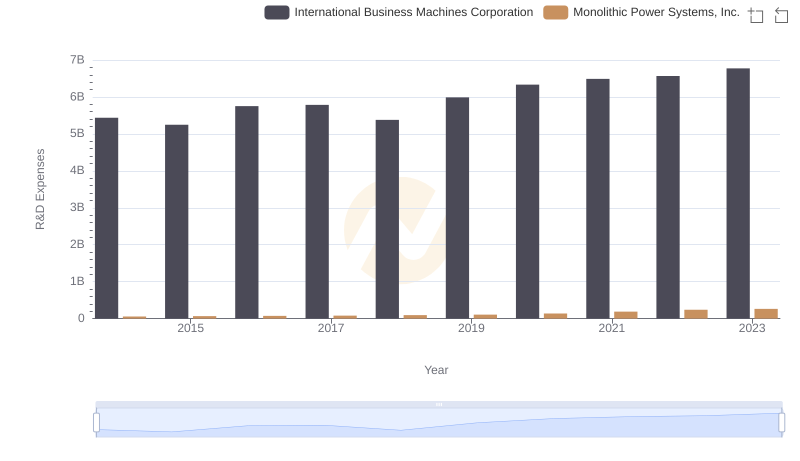
Research and Development: Comparing Key Metrics for International Business Machines Corporation and Monolithic Power Systems, Inc.
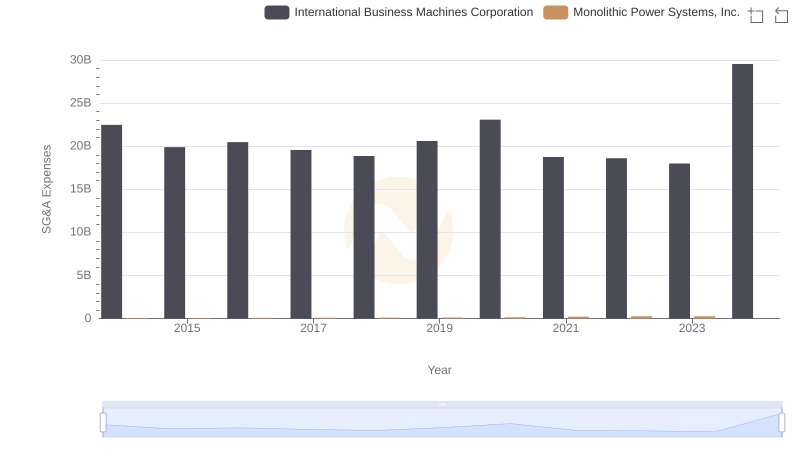
SG&A Efficiency Analysis: Comparing International Business Machines Corporation and Monolithic Power Systems, Inc.
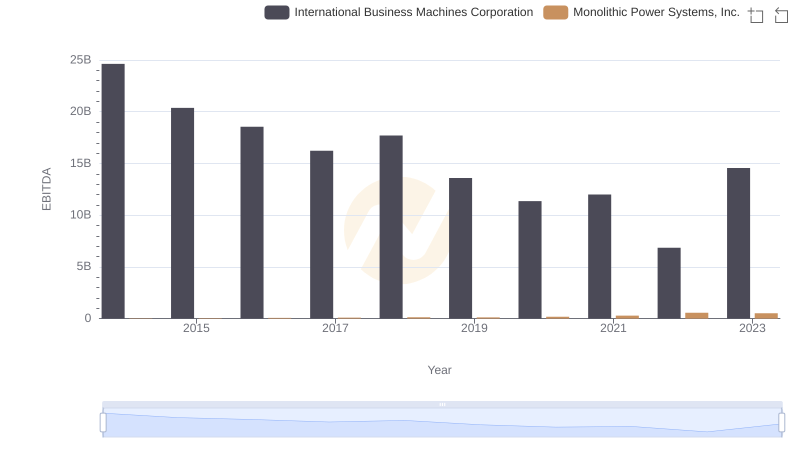
EBITDA Performance Review: International Business Machines Corporation vs Monolithic Power Systems, Inc.