| __timestamp | II-VI Incorporated | International Business Machines Corporation |
|---|---|---|
| Wednesday, January 1, 2014 | 456545000 | 46386000000 |
| Thursday, January 1, 2015 | 470363000 | 41057000000 |
| Friday, January 1, 2016 | 514403000 | 41403000000 |
| Sunday, January 1, 2017 | 583693000 | 42196000000 |
| Monday, January 1, 2018 | 696591000 | 42655000000 |
| Tuesday, January 1, 2019 | 841147000 | 26181000000 |
| Wednesday, January 1, 2020 | 1560521000 | 24314000000 |
| Friday, January 1, 2021 | 1889678000 | 25865000000 |
| Saturday, January 1, 2022 | 2051120000 | 27842000000 |
| Sunday, January 1, 2023 | 3541817000 | 27560000000 |
| Monday, January 1, 2024 | 3251724000 | 27202000000 |
Unveiling the hidden dimensions of data
In the ever-evolving landscape of technology and manufacturing, understanding the cost dynamics of industry giants like International Business Machines Corporation (IBM) and II-VI Incorporated is crucial. Over the past decade, IBM has consistently maintained a high cost of revenue, averaging around $36.5 billion annually. This reflects its expansive operations and global reach. In contrast, II-VI Incorporated, a leader in engineered materials and optoelectronic components, has seen its cost of revenue grow significantly, from approximately $457 million in 2014 to a peak of $3.5 billion in 2023, marking a staggering 675% increase.
While IBM's cost of revenue has shown a downward trend, decreasing by about 41% from 2014 to 2023, II-VI's growth trajectory highlights its aggressive expansion and market penetration. This data provides a fascinating glimpse into the strategic financial maneuvers of these two industry leaders.
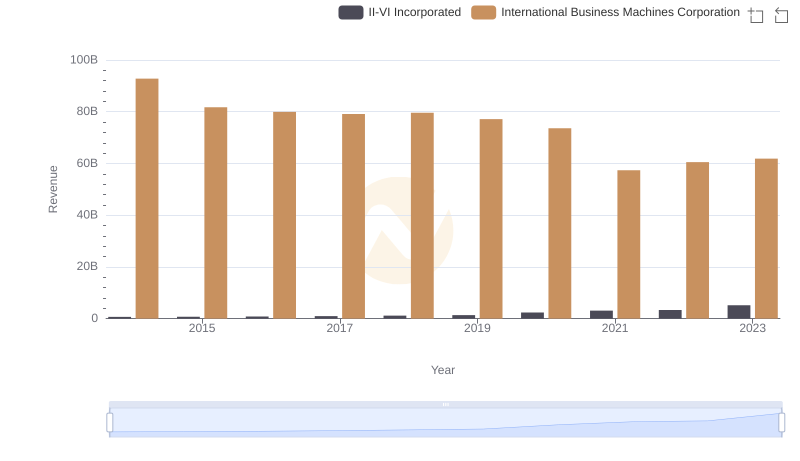
Breaking Down Revenue Trends: International Business Machines Corporation vs II-VI Incorporated
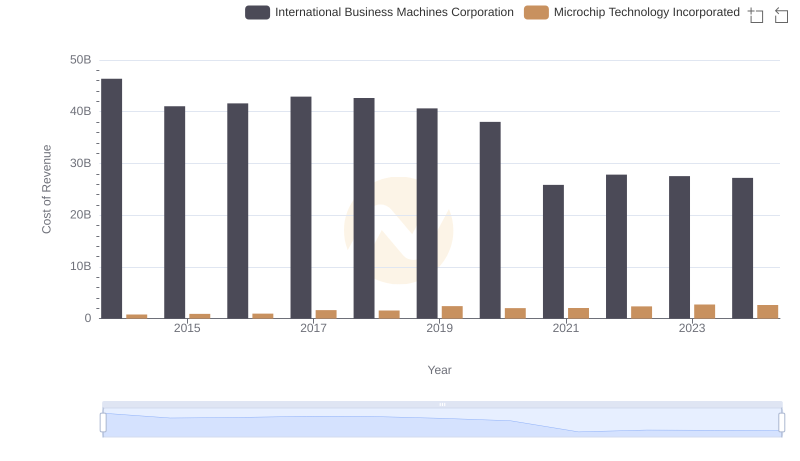
Comparing Cost of Revenue Efficiency: International Business Machines Corporation vs Microchip Technology Incorporated
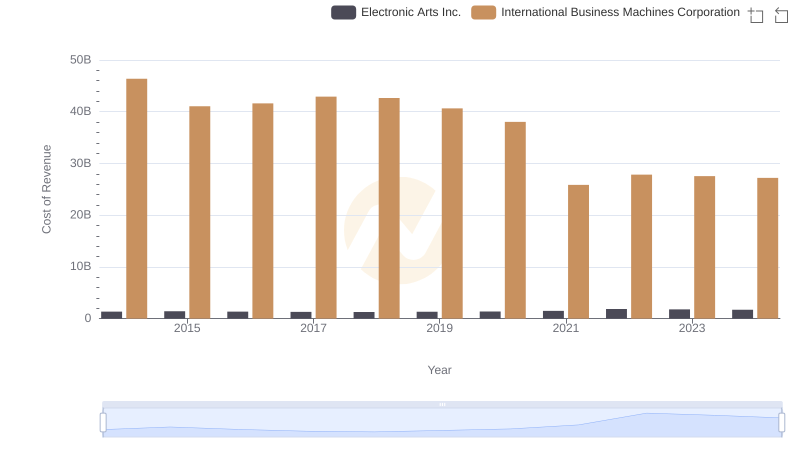
Comparing Cost of Revenue Efficiency: International Business Machines Corporation vs Electronic Arts Inc.
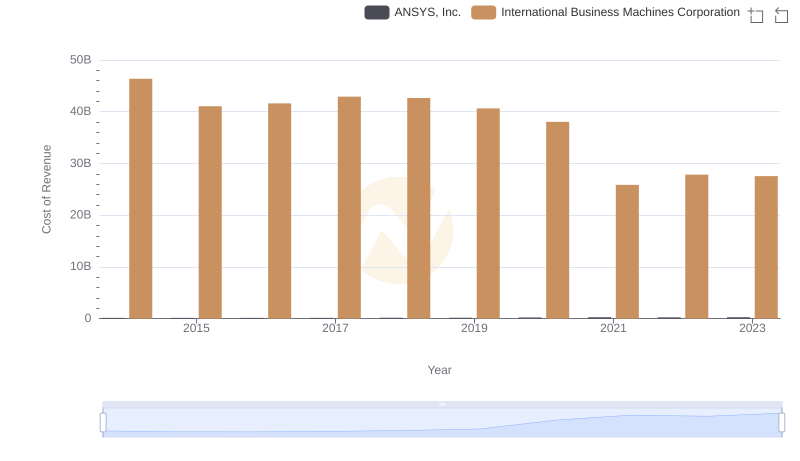
Cost of Revenue: Key Insights for International Business Machines Corporation and ANSYS, Inc.
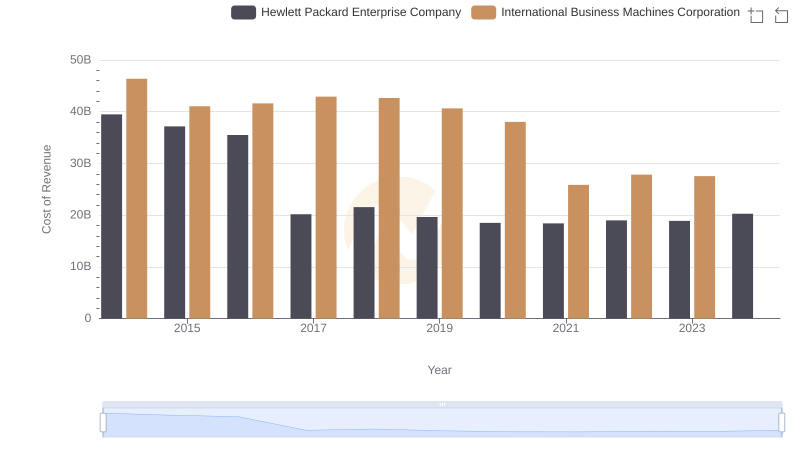
Analyzing Cost of Revenue: International Business Machines Corporation and Hewlett Packard Enterprise Company
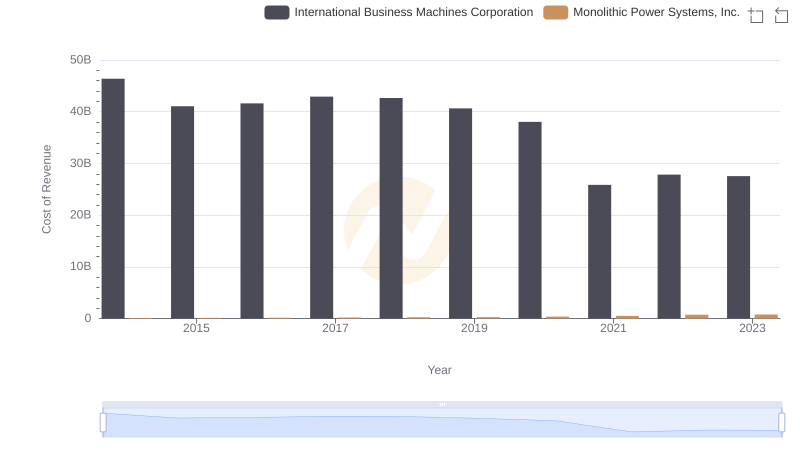
Cost of Revenue Comparison: International Business Machines Corporation vs Monolithic Power Systems, Inc.
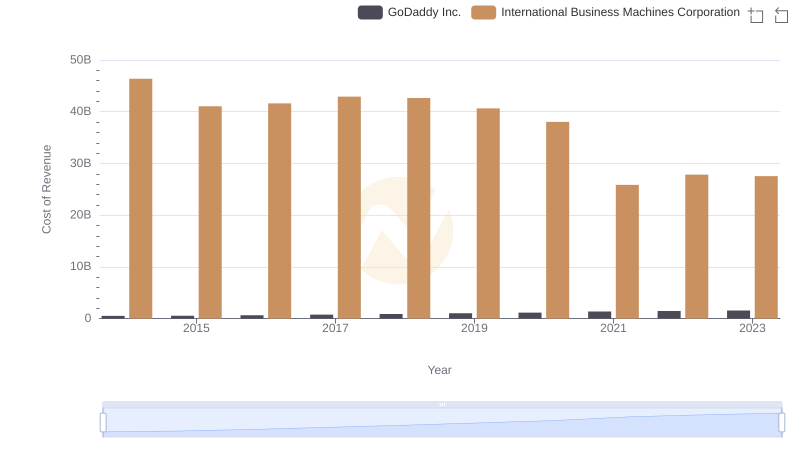
Cost Insights: Breaking Down International Business Machines Corporation and GoDaddy Inc.'s Expenses
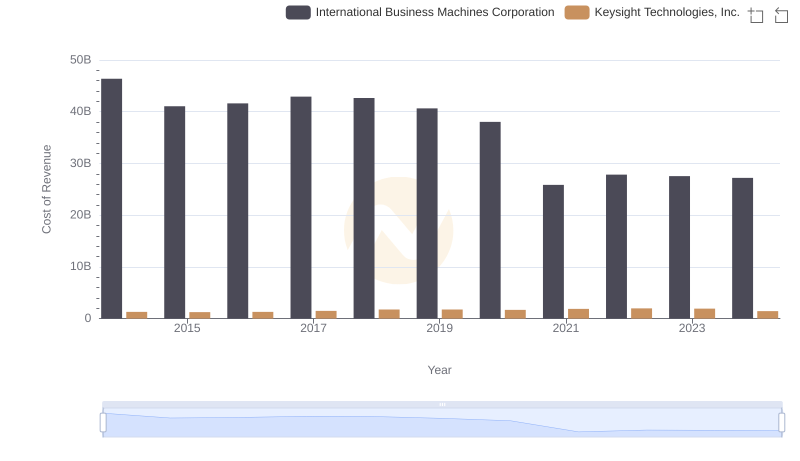
Cost of Revenue Trends: International Business Machines Corporation vs Keysight Technologies, Inc.
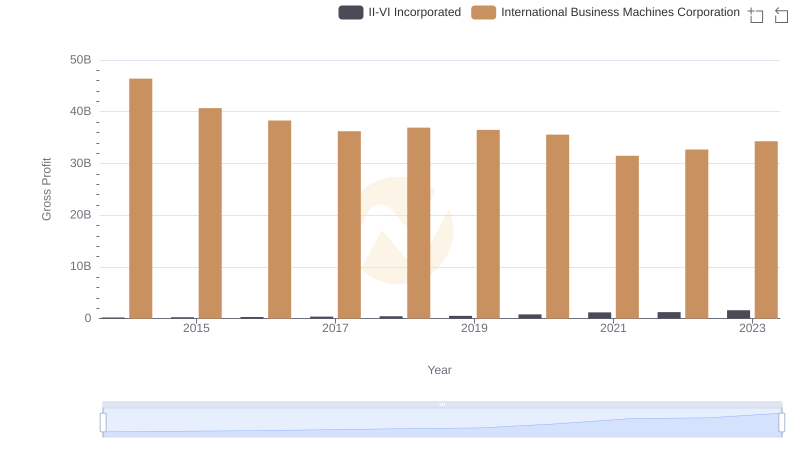
Gross Profit Trends Compared: International Business Machines Corporation vs II-VI Incorporated
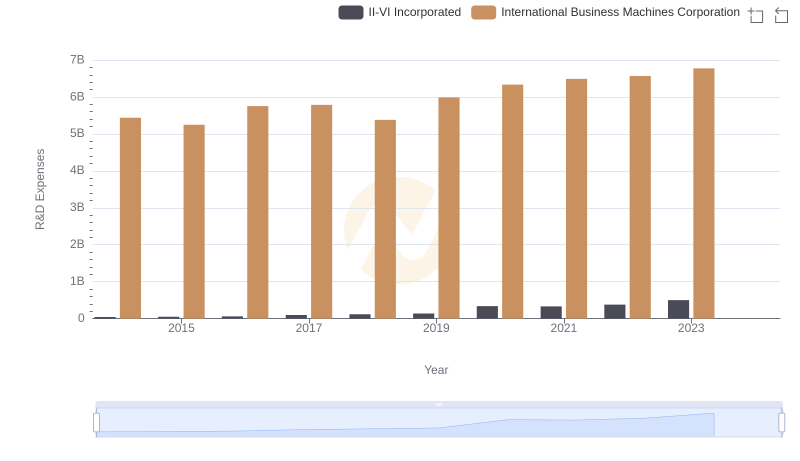
Research and Development Investment: International Business Machines Corporation vs II-VI Incorporated
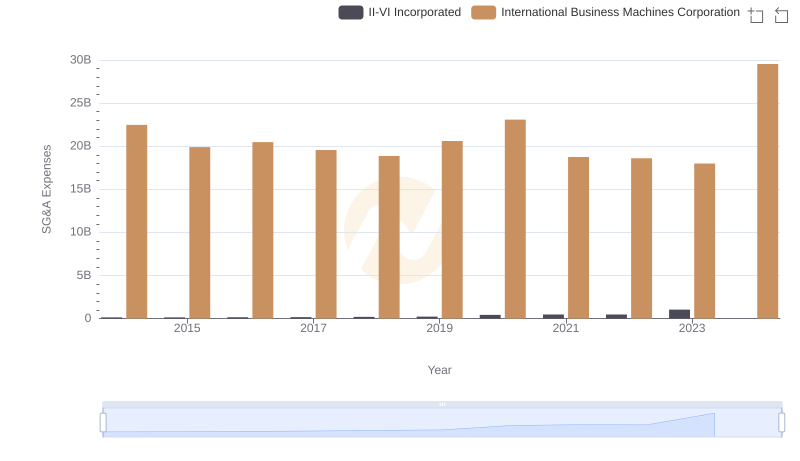
SG&A Efficiency Analysis: Comparing International Business Machines Corporation and II-VI Incorporated
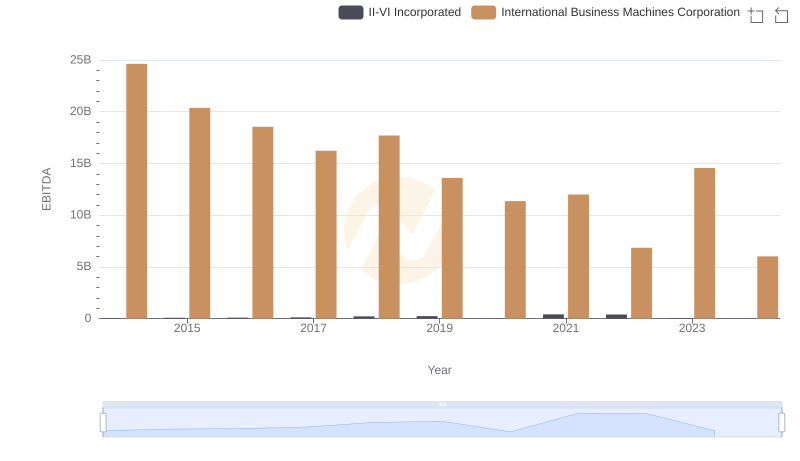
A Professional Review of EBITDA: International Business Machines Corporation Compared to II-VI Incorporated